Many people ask if there are any particular technical setups that I like to look at and what the best way to trade them is. My all-time favorite heavily involves Support and Resistance levels, and using these as breakout levels. The art lies in finding them and then managing trades appropriately.
In this article we’ll focus on using Bullish and Bearish Engulfing Bars to identify support and resistance levels, and present the analysis that goes behind implementing such a system. Implementation also requires understanding the Exits of the system, not just the entry, so we look at how to determine these factors.
As you’ll find, nothing beats having rules, and being able to historically test them inside-out.
In conclusion Bullish and Bearish Engulfing Bars turn out to be very good signal providers, and should be part of anyone’s armory.
First-off let’s define what these bars are. The first time I encountered them was anecdotally from people trading the 4-Hourly time frame.
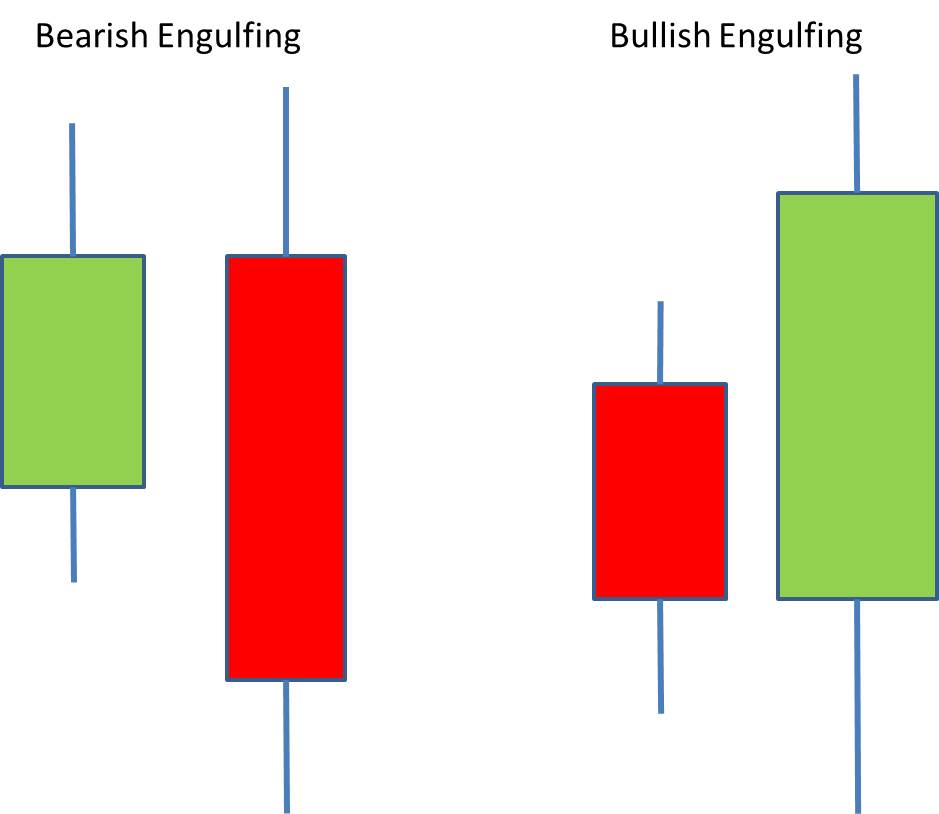
To make the definition precise: the second 4-hourly bar must have higher highs and lows, and the close must be lower than the previous low for a bearish engulfing candle or higher than the previous high for a bullish engulfing candle.
The first thought that comes to mind is that 4-hourly candles tend to have arbitrary start and end times. These tend to be dependent upon the time-zone the broker is in. For instance a broker with a time-zone of GMT+2 will have the start of his candles offset by two hours compared to the one with a time-zone of GMT.
So we can introduce the idea of a rolling bearish or bullish engulfing candle.
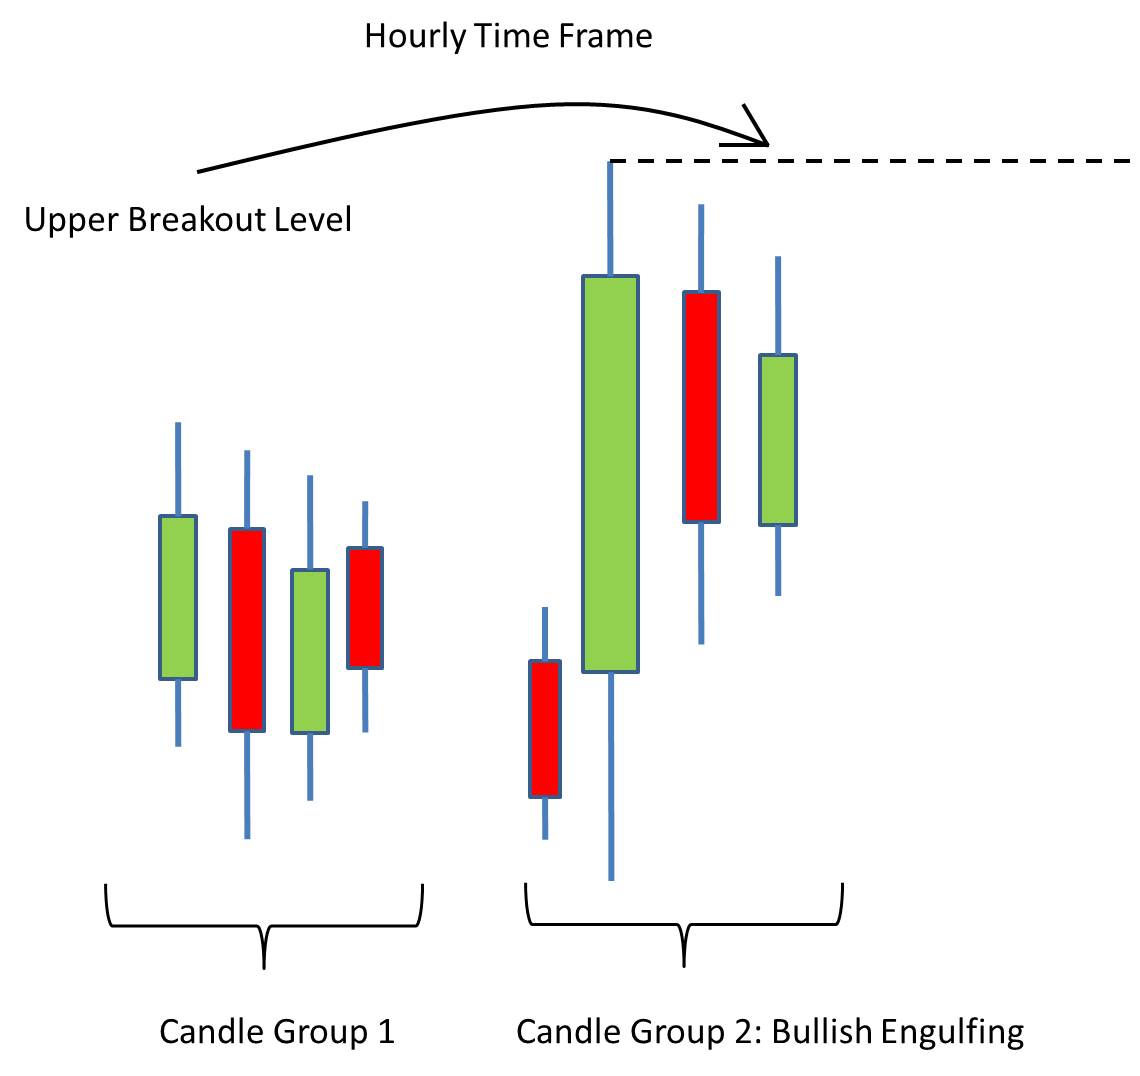
If we look at the hourly time frame and bunch groups of four candles together we can compare the current group of four to the previous group of four on a rolling basis. Here’s a diagram to make it clearer. In this case the diagram shows a Bullish Engulfing 4-hourly group of candles:
Using this approach removes both the arbitrariness of the four-hourly cut-off (assuming that hourly bars are somehow more fundamental), and increases the number of signals we generate (since there are more bars).
Rolling means that after a new hourly candle is generated we add this one to the beginning and drop the last one at the back of our group of hourly bars, and repeat the analysis above.
The usual approach is to trade in the direction of the engulfing candle. So the upper breakout level is set by the high of the current four-hourly group of candles, as in the graphic above.
Similarly for a bearish engulfing four-hourly group the breakout level is the low of the current group of four bars on the hourly time frame.
As is usual, once price breaks out you trade in that direction.
So how does such a trade perform?
For the purpose of this article, we will look at EURUSD (for the usual reasons: liquid, tight bid ask spread, and everybody’s in it!). I’m using minutely data going back to Jan 2010 as sourced from ForexTester (which you can find on the Resources page), to determine the trade’s performance.
Let’s look at an idealized trade:
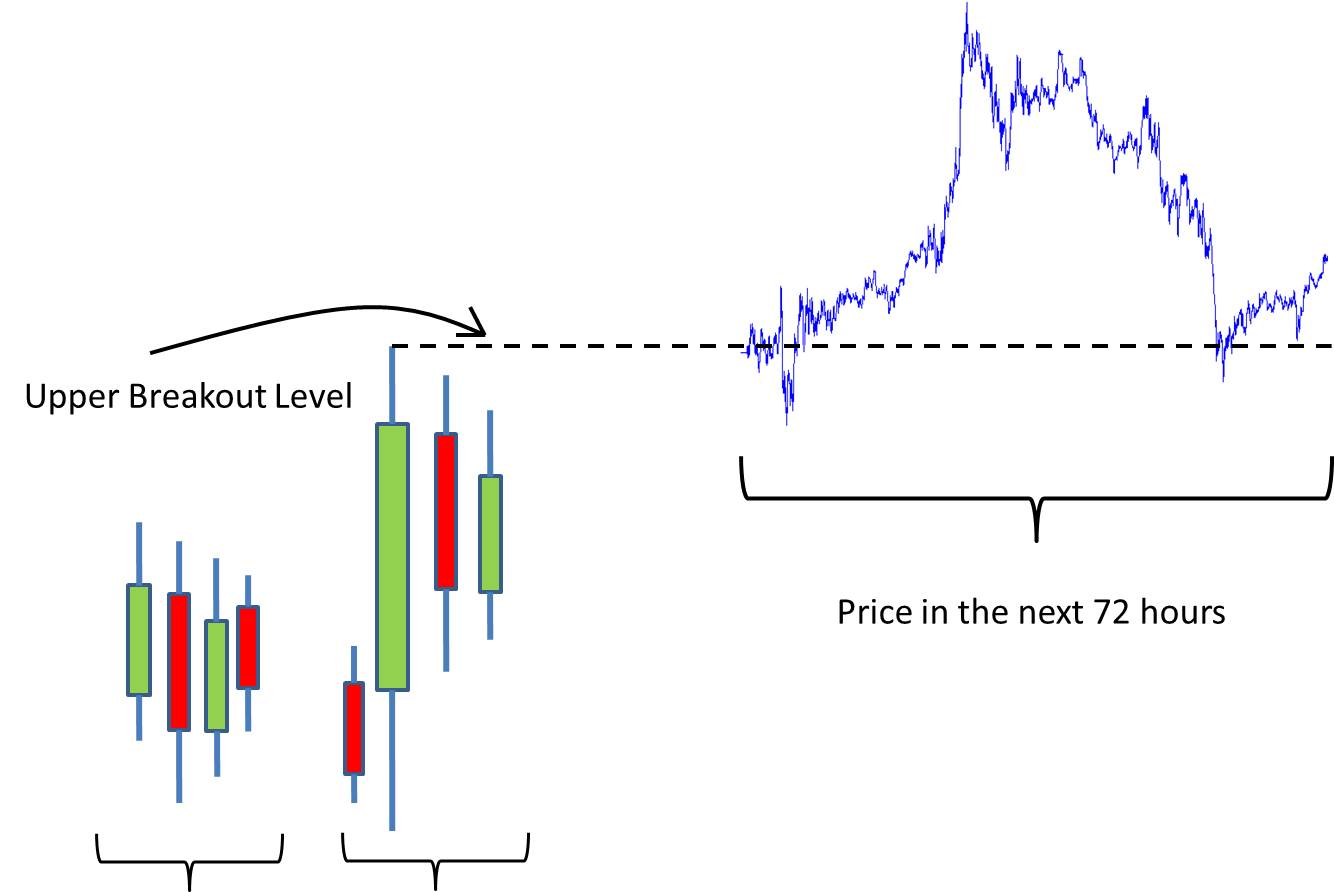
Admittedly I took the first best one out of the data and it just so turned out to be a super trade!
As with any trade that you enter, you need:
- A stop: in essence your signal has been invalidated
- A target: the most likely point it will hit
- Maybe some sophisticated way of monitoring the trade and getting out early
We’ll ignore (3) for the time being and look at (1) and (2). The best way to figure out where to put the SL and TP levels is to look at all such instances where we were signalled a trade and look at the average path of EURUSD price following a breakout.
For the long trades triggered by a break to the upside, above the high of the 4-hourly bullish engulfing candle, the average path after the breakout is:
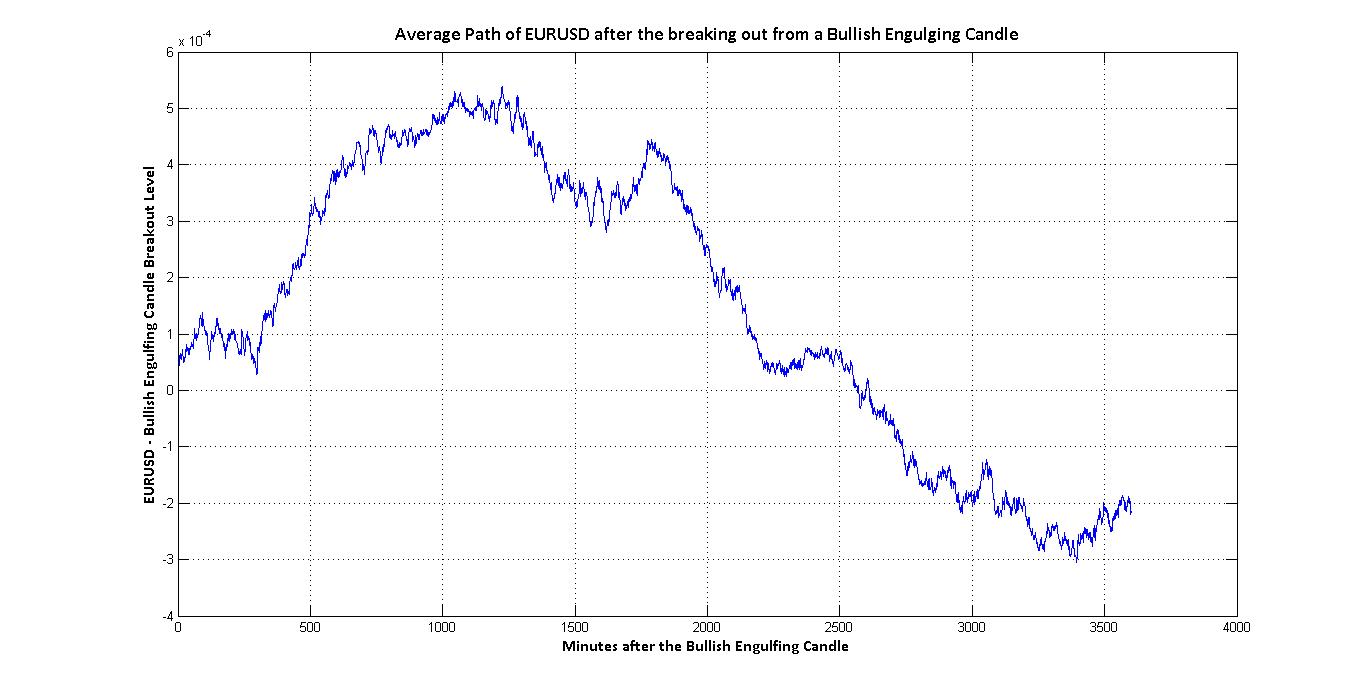
This chart shows 3,600 minutes from the end of the Bullish Engulfing Candle. The plot is actually
EURUSD Price – Breakout Level
So in essence we are saying that the sweet spot, if a trade gets triggered is to hold it for 1000 minutes, which is roughly one day.
An interesting question is to see how long after the Bullish Engulfing Candle gets formed it takes for price to break out to the upside occurs. Since times are obviously positive, it makes more sense to look at the median of times, rather than their average. Here is a frequency plot of breakout times:
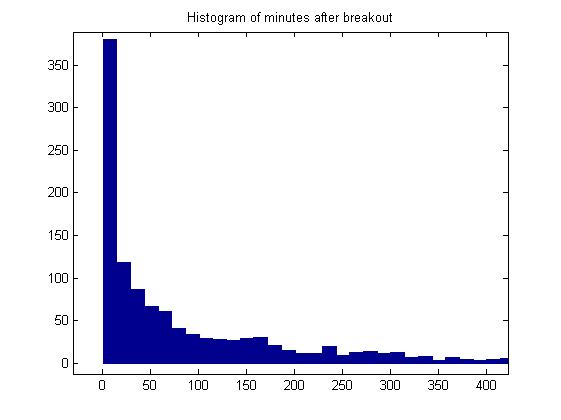
With the median time being 67 minutes.
If you’ve kept with me so far, the first thing to have struck you hard by now is that the average path in the chart above is positive right through the first day and a half!
The second thing to notice is the pip scale on that chart. We’re talking average profits of 6 pips at the peak.
You’re probably saying, is 6 pips worth that effort? Well that’s 1400 trades. So if the average per trade is 6 pips after 1 day, that’s 8,400 pips in total. Not bad going, any which way you slice it. (And that’s just for the long side).
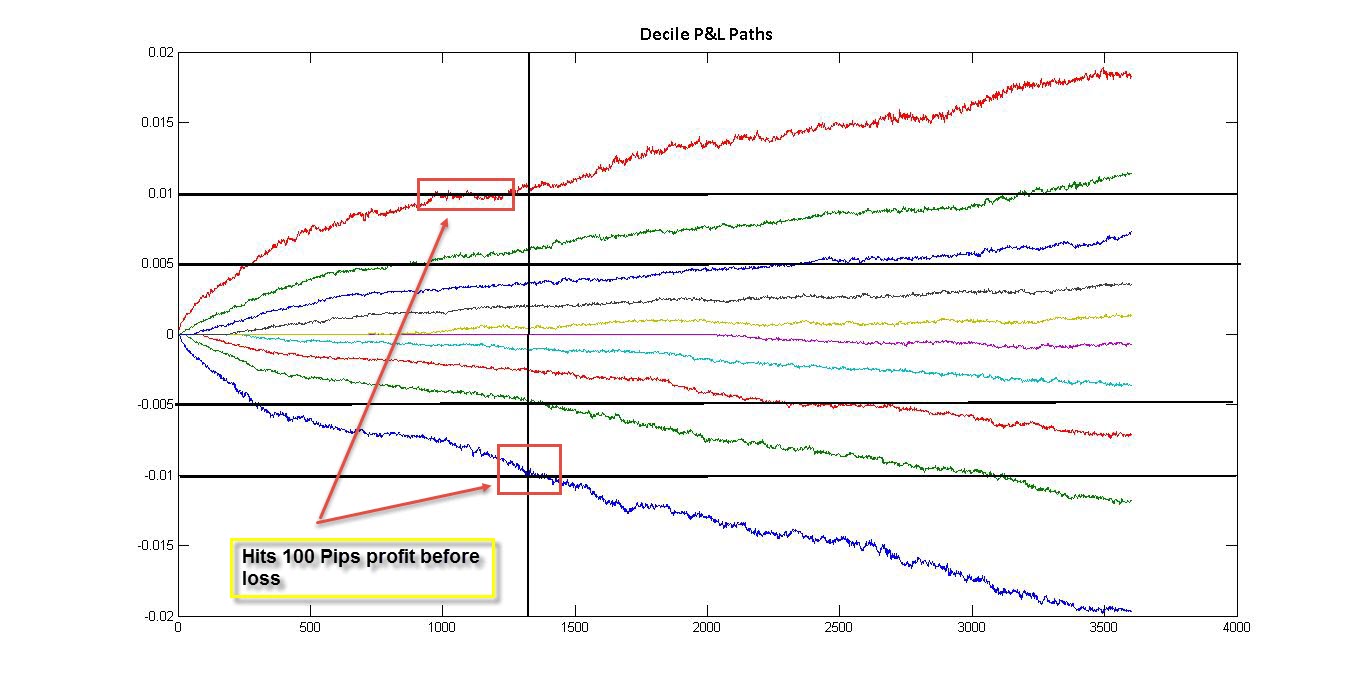
Ok, the next step is to look at paths in more detail. We split the average path into 10 sections from worst to best, and average the paths for each section. This is called splitting the paths up into deciles.
Looking at the most extreme Profit and Loss paths, you see that the stop loss of 100 pips is reached before the 100 pip take/profit. The point at which this happens is also the sweet spot for the average path.
In essence we’ve set ourselves up for following strategy on the long side:
- Use hourly rolling bars to determine bullish engulfing candles
- Use the maximum of the current four hourly group to determine the upper breakout level
- Set a stop loss for 100 pips
- Set a time target of 1 day
- Set a take-profit of 100 pips or trail your stop
What about the short side?
We can repeat the same exercise of looking at the average paths to the short side. Note, that to generate this chart we have plotted
Engulfing Candle Low – EURUSD price
which is the P&L of taking the short position. So though we expect the price to go down, we would want to see the average P&L curve to slope up:
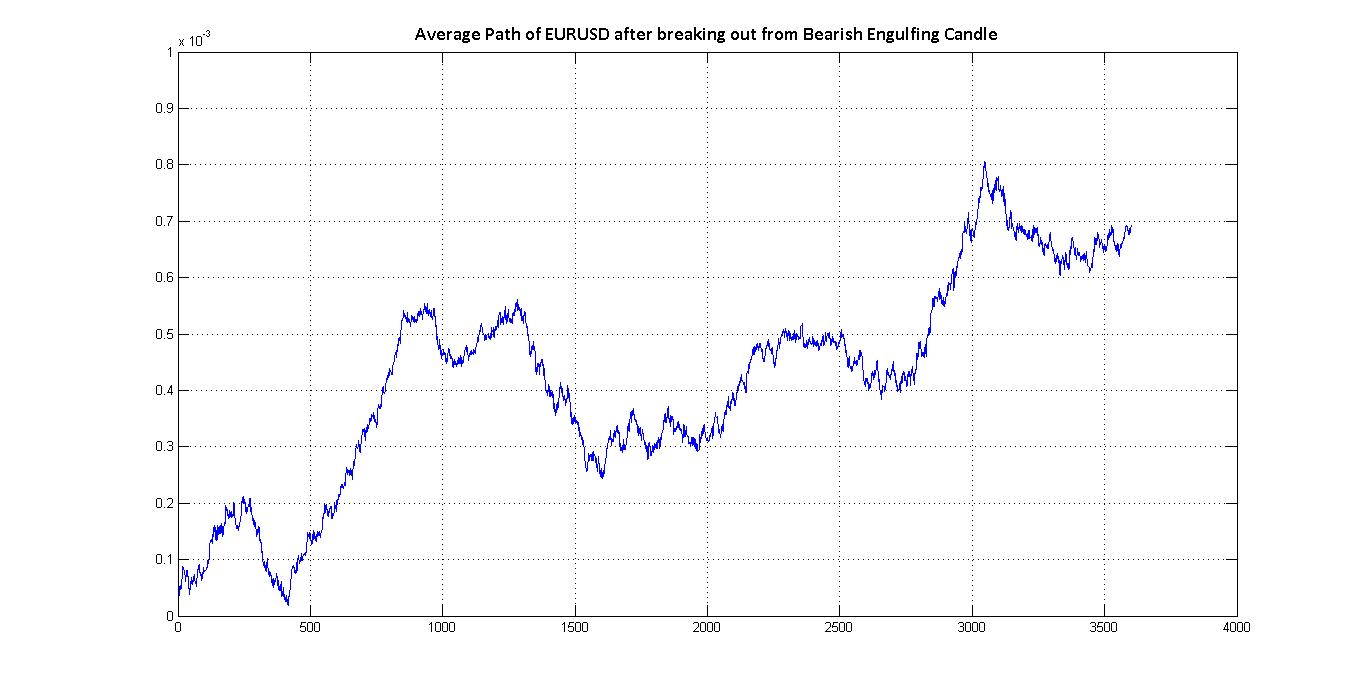
The average path is even better. The first sweet spot is at the same time as for the upward breakout on a bullish engulfing calendar. But we see that the trend continues for longer. Of course that strongly relates to the downtrend in EURUSD since 2010, which the start of our testing data.
With that in mind we can discard holding periods post one day.
Now for the P&L path deciles to determine where we can put our stops and take profits:
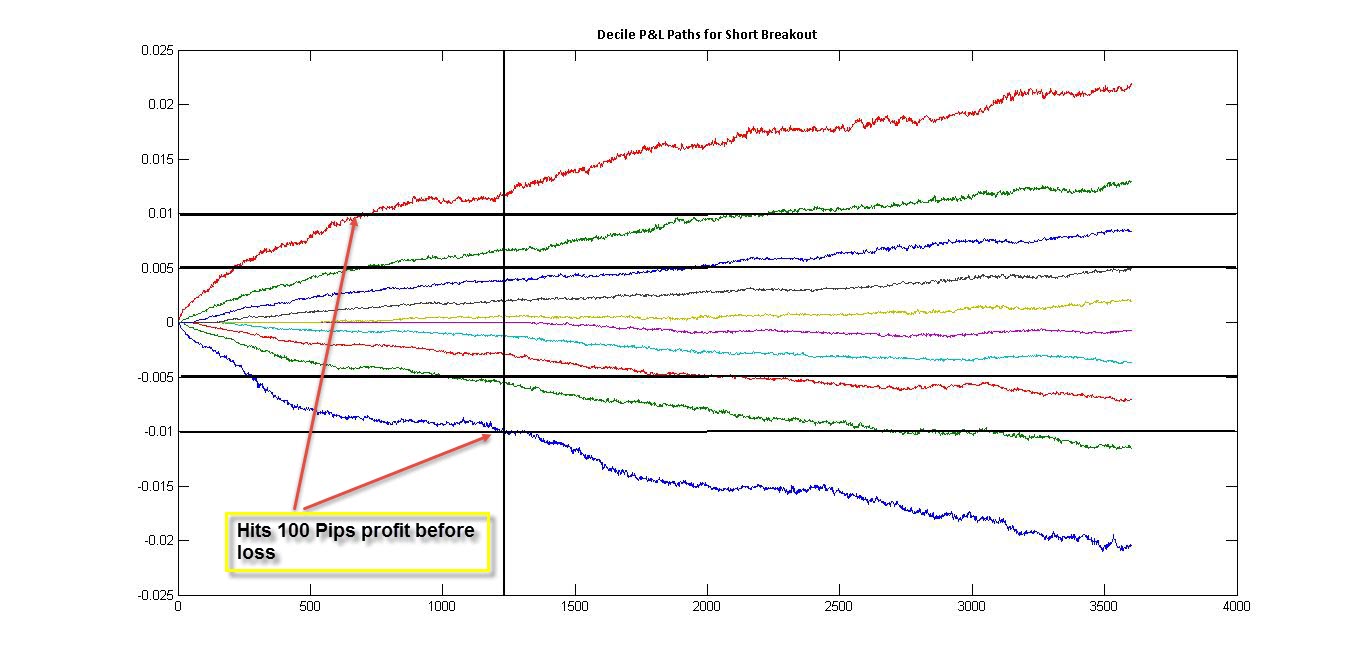
A 100 pip stop-loss seems even better placed, as it gives the trade much more time to move and capture profit. Again this is in part due to the downward bias in the data over which we are testing.
So for the short side we can implement similar rules:
- Use hourly rolling bars to determine bearish engulfing candles
- Use the minimum of the current four hourly group to determine the lower breakout level
- Set a stop loss for 100 pips
- Set a time target of 1 day
- Set a take-profit of 100 pips or trail your stop
As an aside, there were 1,500 trades here. So a total of 2900 breakout trades in the last 6 years, with average positive profitability of 6 pips at the one-day time horizon. That is a total of 17,400 pips. Not bad going.
However, nothing says it better than a cumulative P&L chart. In the next article, Part II, we’ll look at historical backtests to see what the actual performance looks like, given the above analysis.
Part III will look at what happens if you take the reverse of this trade. That is shorting the low of a bullish engulfing candle and buying the high of a bearish engulfing candle. This is a variant on Linda Rashke’s Turtle Soup and at first glance seems to provide even bigger profit potential.
So stay tuned.
If you’ve enjoyed this article follow me on Twitter and sign up to my newsletter!

Struggling to make the connection between candle group 1 and 2 although I do understand the concept from your description. Is candle group 1 hourly and group 2 consolidated to show 4 hourly candlesticks on a rolling basis? Also what does the y-axis represent in the histogram of minutes after breakout assuming that the x-axis represents minutes. Many thanks for your patience in clarification.
Hi Stuart,
Thank you for taking the time to read the article. The time frame in that figure is hourly. In essence you perform the comparison of the current four hours to the previous four hours. The motivation is in part practical: 4 hours is a “medium”-term frequency which widely used (e.g. on MT4 platforms). The problem however, is that the choice of where you start a four-hourly bar can be quite arbitrary. For instance on various MT4 platforms, depending which time zone the broker is based in, the candles will not match. In that sense the idea arose to perform a “rolling” analysis. So the you always look at the previous eight hours, bunching these eight hours into groups of two, each with four hours in it. These are the candle groups 1 and 2.
With regards to your second question: (indeed the wording in the article is a bit off), the chart shows a distribution of times for the breakout to actually occur, after the pattern is formed. By that I mean that price will settle in the determined hi/lo range, and then will take some time to break out either to the up or downside. So the histogram shows a distribution of times it took for the breakout to occur. So the y-axis counts the frequency of times.
Let me know if this helps.
Hello Corvin,
Many thanks for elaborating so promptly. I am assuming that adjustments on a rolling basis will not be necessary if my broker and I are in sync with GMT i.e both operating in London. The only instance, I can think of making these adjustments is if I want to analyse the 4-hourly bars outside of the default on my broker’s trading platform, which is 4 hourly starting 24:00 GMT.
Keep up your fascinating and insightful work.