Wouldn’t it be great to forecast what the outcome economic news-releases would be? News trading is a favourite for many traders, professionals and novice alike.
For the long-term trader who holds positions over several days or weeks it might lead to clues as to the next big trend.
For intra-day traders it can be a treacherous path. Usually day traders end up losing money, usually because of massive slippage on their stop-orders followed by knock-outs on their protective stops because of the massive whip-sawing that follows afterwards. This article focuses on the pain that can be experienced by day-traders.
Today’s economic release, the ADP Non-Farm Employment, provided a wonderful example of this.
As always, learning from your mistakes is the best way to proceed, and it just so happens that I not only have the trade data to show the pain, but also the underlying market data that goes with it!
In this article I cover:
- What happened to my trades? Slippage, and is it for real?
- How am I supposed to tell what’s dangerous and not?!
- What’s a possible trading framework to take this into account?
As an aside: if you’re already in a trade with profit prior to the news release exercise caution. Protect your profit and cover your loss. As an intra-day trader you always profit from your long term edge, not from the throw of the dice on one trade. So the focus here really is on the mechanics of what you should do with your pending orders.
Let’s set out the background facts:
- I’m trading the EURUSD currency pair (and all charts below and orders relate to this)
- It’s the 6th Jan, 2016. At 13:15 GMT the ADP Non-Farm Employment Change is published. Of course at present we are on a rate hiking cycle, and so these numbers, together with Friday’s Non-Farm payrolls will present a clue as to what Janet Yellen and the FOMC will do going forward. And of course the FOMC minutes from December are released later in the day, adding to the nervousness of the market. But let’s forget about the economic significance for the time being.
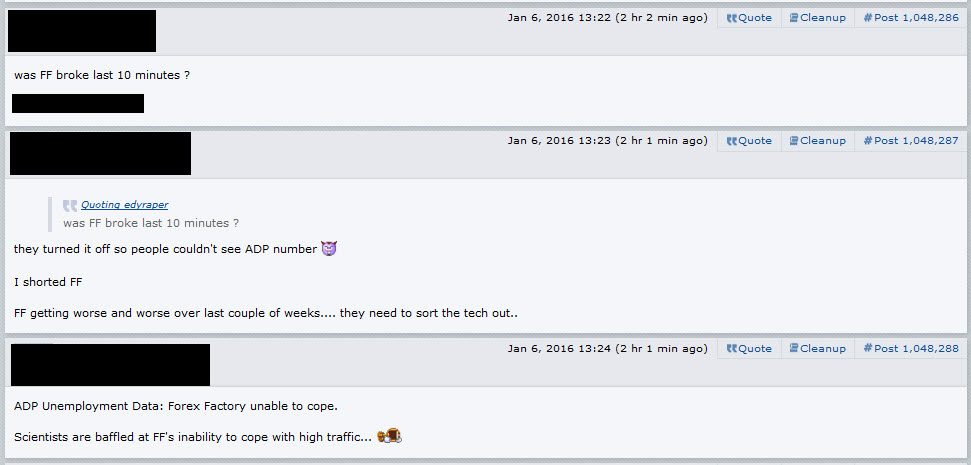
- The number gets released and the market goes haywire. On a more humorous note ForexFactory seizes up before the release:

- As if this isn’t bad enough people incur slippage:
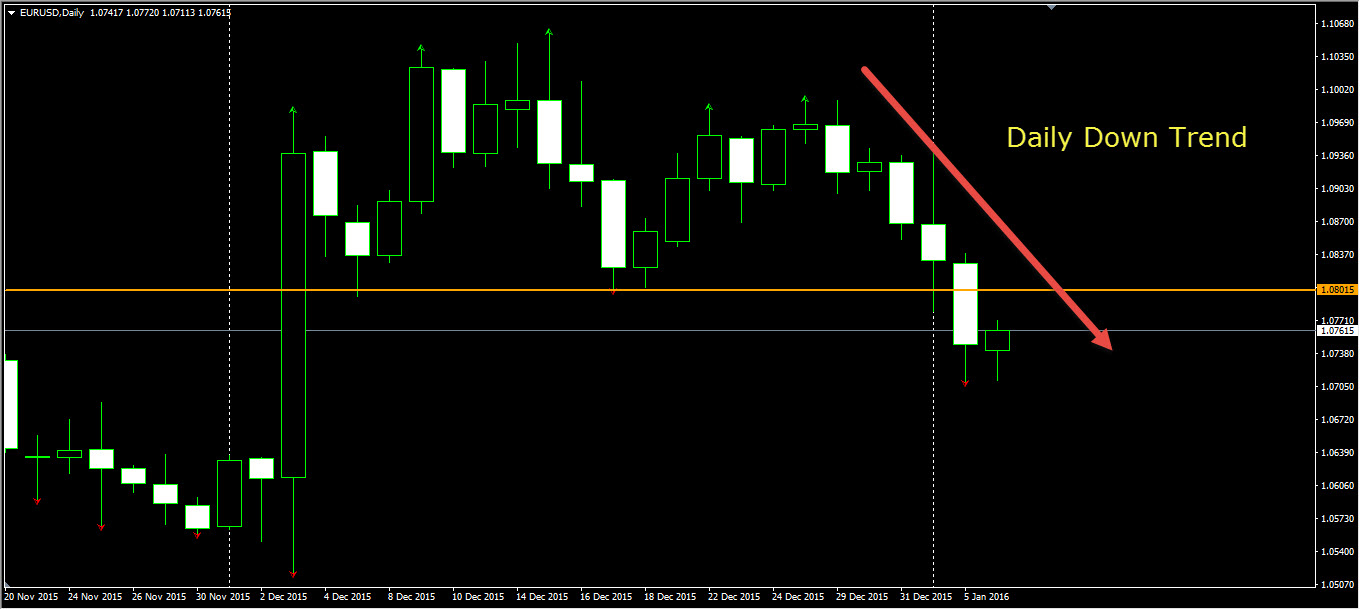
- And to add insult to injury the market goes into free fall, 30 pips to the downside in one minute only to rebound (oh yeah, did I say Employment Change came in at 257K vs 193K expected, should be good news for the Dollar, no?) This is a perfect trap set-up. Why? Let’s have a look at the daily chart which shows down trend forming on the daily bars:
As well as the 30-minutely chart with a clear resistance line forming around today’s London lows and yesterday’s New York lows.
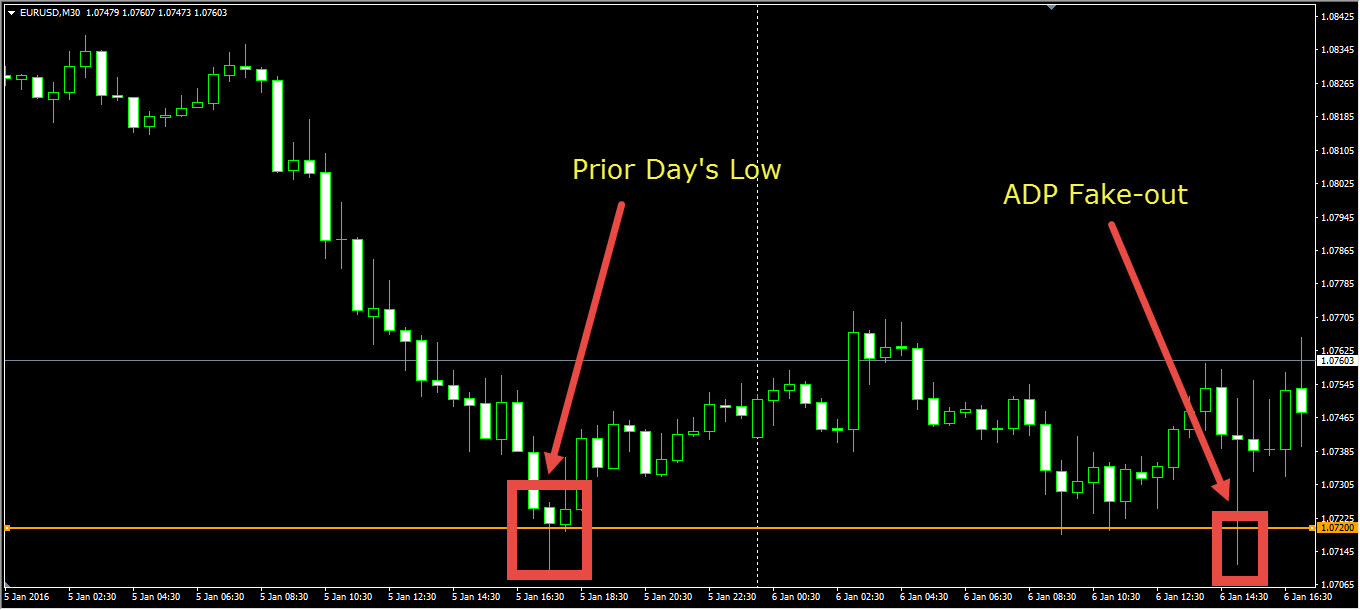
Given the down-trend and the resistance line it’s no surprise to have sell-orders clustered there (either from human traders or systematic rule-based algorithms, I certainly had some trades there). - The outcome for me and apparently others out there (see the ForexFactory posts above) was slippage and resulting losses on the whip-saw to the upside.
This is where the detective work starts to be fun. Are brokers chasing stops? Are they widening stops on purpose? Was this all a setup to shake out the retail investor?
In a nutshell, I don’t think so.
Regardless, by looking at the data something quite interesting crops up instead: a method of side-stepping all these shenanigans.
For starters let me state that I had identical trades with two separate brokers, and I am happy to say that the trades all were executed equally badly, and at very similar prices! At least this takes the sting out of the equation, since the two brokers are very unlikely to have collaborated. So it’s more likely that the price action was due to crazed market participants (especially given the big surprise), rather than the evil bogey man lurking in the closet.
Following were the trades:
Sell Stop Orders @ 1.07276 and @ 1.07323. These were executed @ 1.07186 each at 13:15:09 GMT. That’s a massive slippage to experience! (The other broker executed these at 1.07143).
A natural reaction is to pull up the minutely chart on MT4:
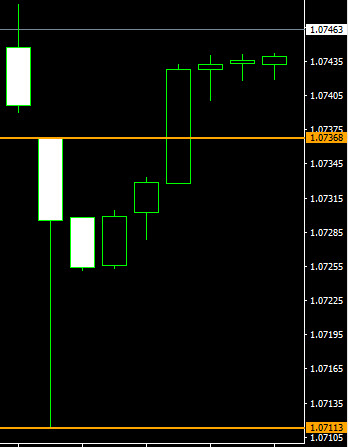
What’s going on here? ADP, ShmADP. Barring the small gap between the 13:14 and 13:15 candle, the ADP candle @ 13:15 looks nice, and price should clearly have been hit!!
One of the main rules of testing systems is: TEST YOUR SYSTEM ON THE SAME DATA YOU WILL TRADE. So the best thing to do is to just save the data from your broker. Granted, it can take some time to build up enough history, but at least it allows for forensic analysis. I will cover the details of doing this in a later post (including MT4 code and advice on VPNs). And when I say save the broker’s data I don’t mean getting historical minutely bars. The chart above clearly shows how useless that can be when push comes to shove.
I’m talking Tick Data!
So let’s look what happened in those two minutes: 13:14 and 13:15. The chart shows individual ticks (bid and ask) during this period.
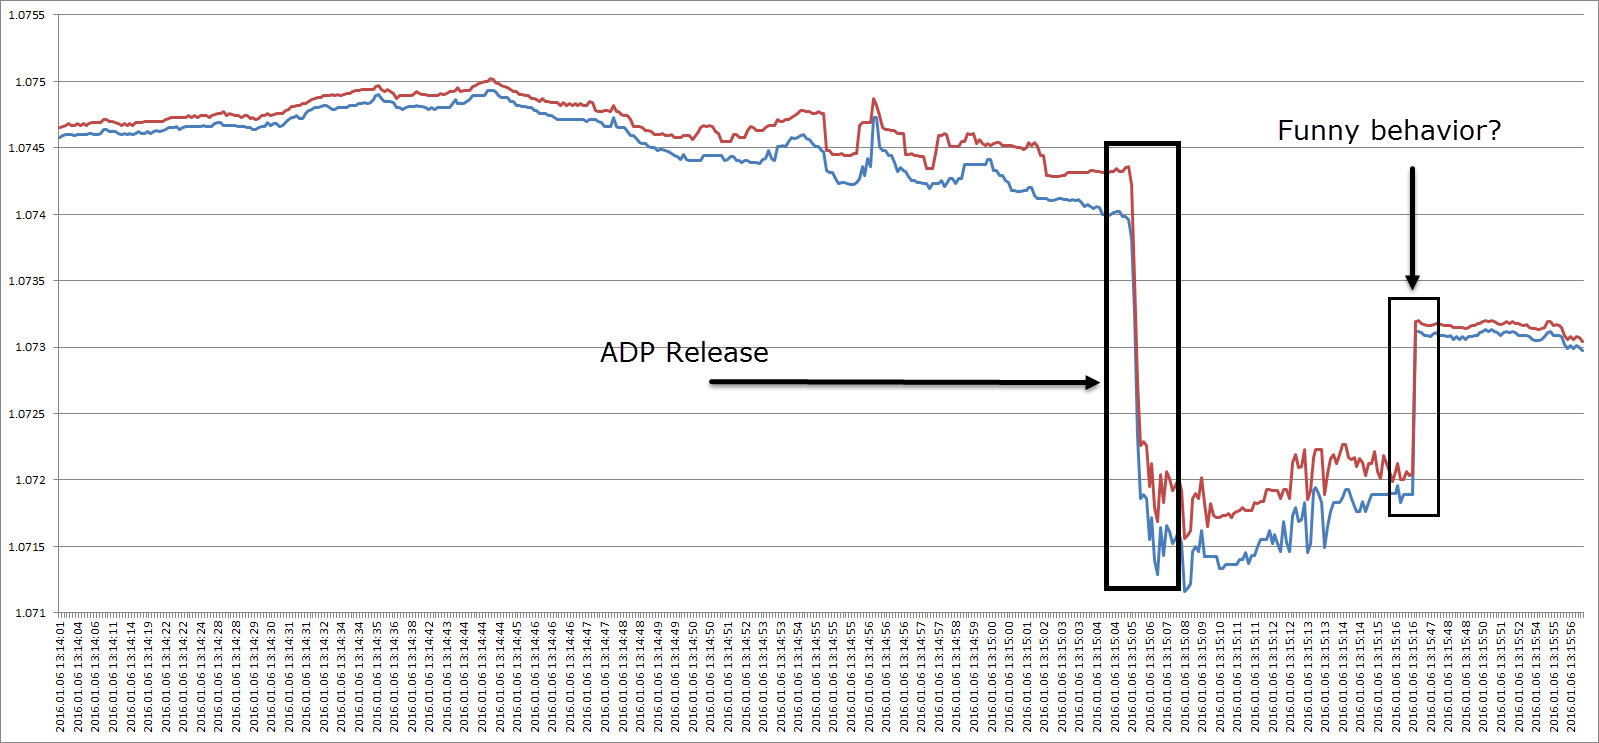
Two things stand out: a widening of the bid/ask spread prior to the announcement, a price collapse during the announcement period, and funny behaviour shortly after the volatility in the market. Price then resumes to what seems normal behaviour.
Zooming in on the ADP Release:
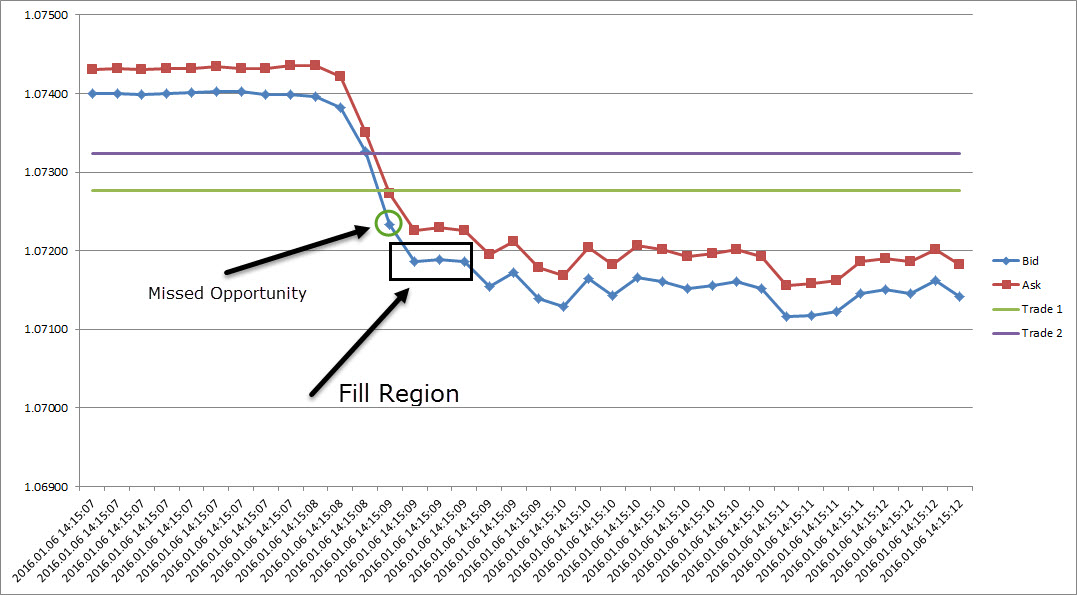
This is a clear example of a Fast Market. Price goes through the order levels fast and in big step sizes. The missed opportunity tick was at 1.07233. Not much to be had. Price then settled at 1.07186, where both orders were filled. Not bad going given that price dropped from 1.07326 to 1.07155 in literally less than a second.
A possible explanation is the complete seizure of liquidity in this tiny fraction of time, where market participants are desperately trying to manage the order flows they are seeing. Another way to look at it is that nobody was willing to buy all the way to 1.07155. Given the upside surprise on the ADP, it’s no surprise: who wants to be short dollars with a number like that?
That explains the slippage, which in retrospect isn’t that bad. Actually, well done by the broker. But what about that big gap to the upside?
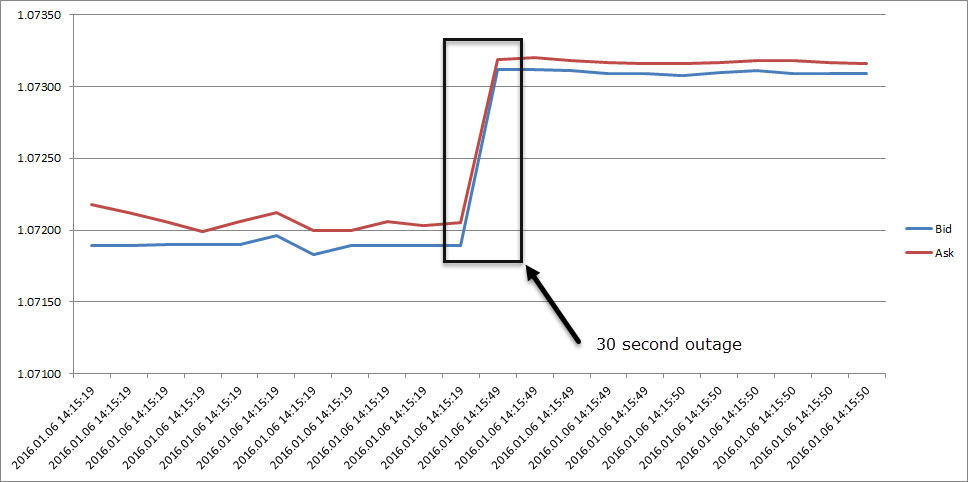
That was a 30 second outage. Was the market really out for that time? No. For starters the log file shows that the connection to the broker was not interrupted (which might explain a break in recording ticks). Most likely what happened was the broker had enough for 30 seconds, too much volatility, not good enough flow, imbalanced books, etc. And off went the switch. Once the markets resumed the switch went back on at 1.07309.
A couple of side notes here: any system that would make you believe you could have bought this dip is obviously kidding you. Any stop orders you think you could have filled anywhere near the top of the candle are kidding you. This minutely candle is pure toxic. Bad market.
Anybody going in with leverage into this market, trying to short it, and getting out would have been whip-sawed.
So what can you do? The answer is simple: get out prior to this hiccup. Ok, but what if you don’t have access to an Economic Calendar, or even if you do, you can’t remember what ADP stands for, or you haven’t read a single economic article in living memory to understand the importance of job reports or their impact on future FED decisions.
Here is a solution.
Let’s start by plotting the bid/ask spread and its 30-period moving average from 00:00 until 13:14
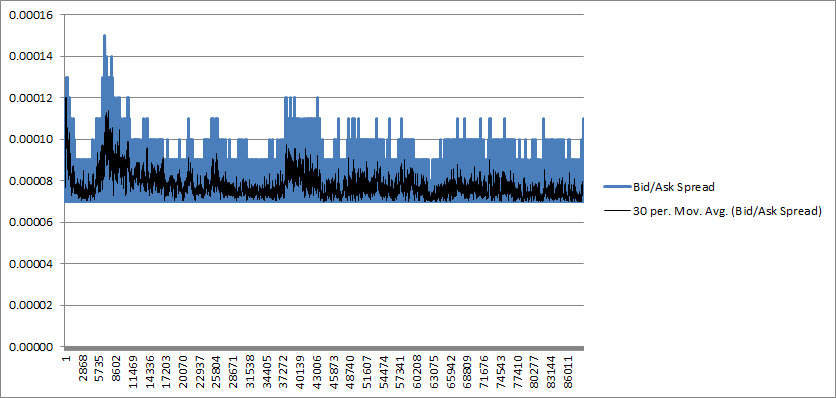
The moving average oscillates between 0.7 pips and 1.0 pip, except maybe for the brief period prior to Tokyo open. Not bad.
And what happens as of 13:14?
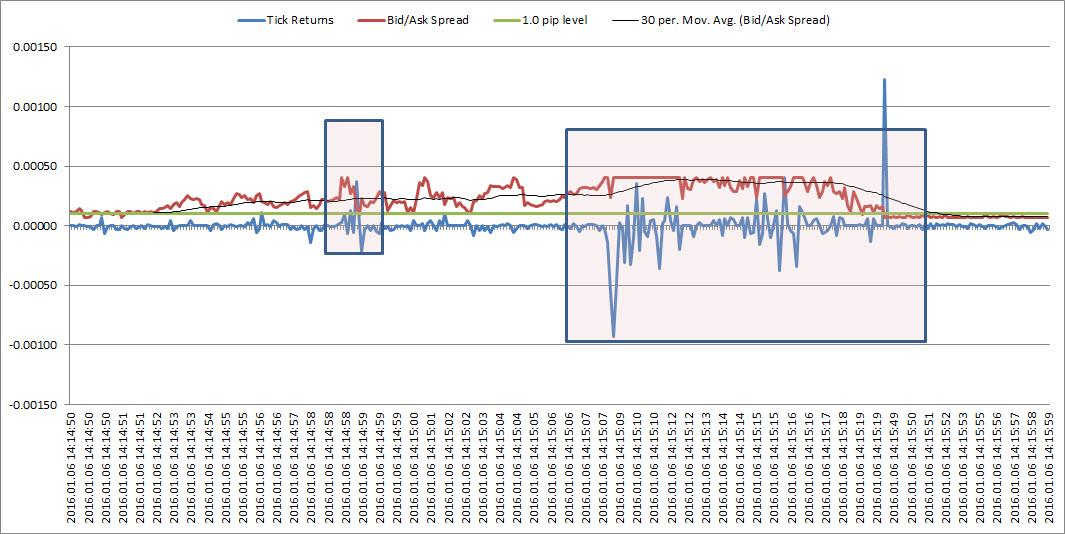
The average bid/ask spread widens out above 1.0 pip, steadily increasing, until it maxes out at 4.0 pips. That’s a massive increase in size. This also corresponds to the tick volatility returns. The big spike on the right hand side of the chart corresponds to the broker reset, and corresponds to the bid/ask spread coming back in to the 0.7 to 1.0 range as before the event.
What’s this say about news releases? Brokers care about them. Enough to make pricing disadvantageous. Do they do it instantaneously? No. There is enough of a hint in the market that something will happen.
What does “something will happen mean” in this context: increased tick volatility. Ticks are the prices at which you can trade, and nothing in between. Increased tick volatility means kissing reasonable trading goodbye.
So how do you protect against this? There are a large number of HFT guys out there who just shut down prior to such announcements. They’ve got calendars. On the other hand monitoring this massive increase in bid/ask is enough of a clue. Market makers have their own algorithms for widening the spreads prior to news-releases and tightening them afterwards when the market has quietened down again:
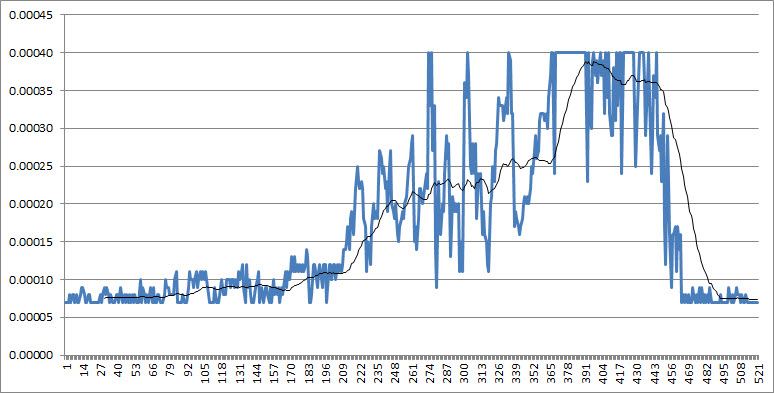
So a nice and easy way is to implement a global shut down of all orders / trades prior to such an event. I’ll post an MT4 implementation for this bid/ask vol in a later post. The choice how to implement is yours: either take the orders out and go fishing for the rest of the day or re-instate them post the even (assuming they still make sense, given any breaches in levels).
As a side-note the price behaviour is very telling. Plenty of buyers at the 1.0710 level.
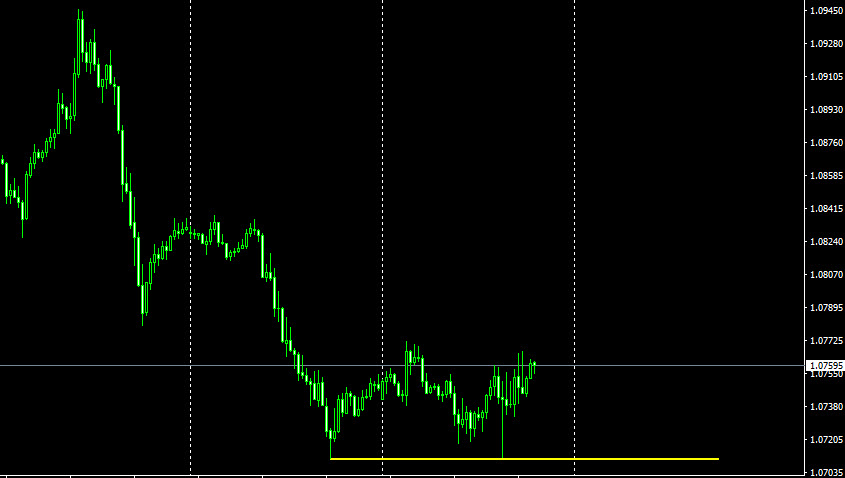
Incidentally this is also the picture for EURUSD for the first three trading days of the year. Not too rosy.

Leave a Reply