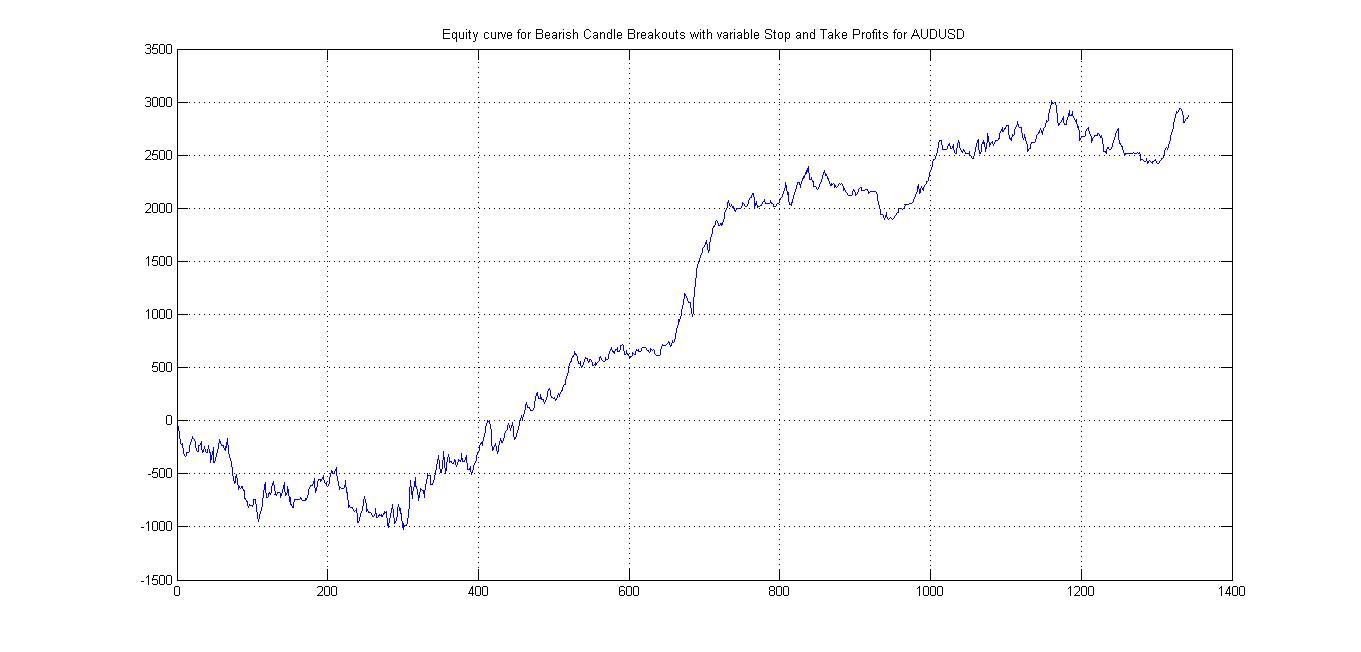
This is the third article in the series on trading the Bullish and Bearish Engulfing candle stick patterns. Following on from Part I and Part II, we will look at trading the short signals for AUDUSD, EURUSD, GBPUSD, USDJPY, and USDCAD.
Let’s recap the results for the long side:
- We used hourly rolling bars to identify the appropriate four-hourly patterns
- Trading in the direction of the breakout was profitable
- There was a sweet-spot for holding the trade for roughly 12 hours
- After using a fixed stop it turned out to be better to use an adaptive stop set by the height of the pattern
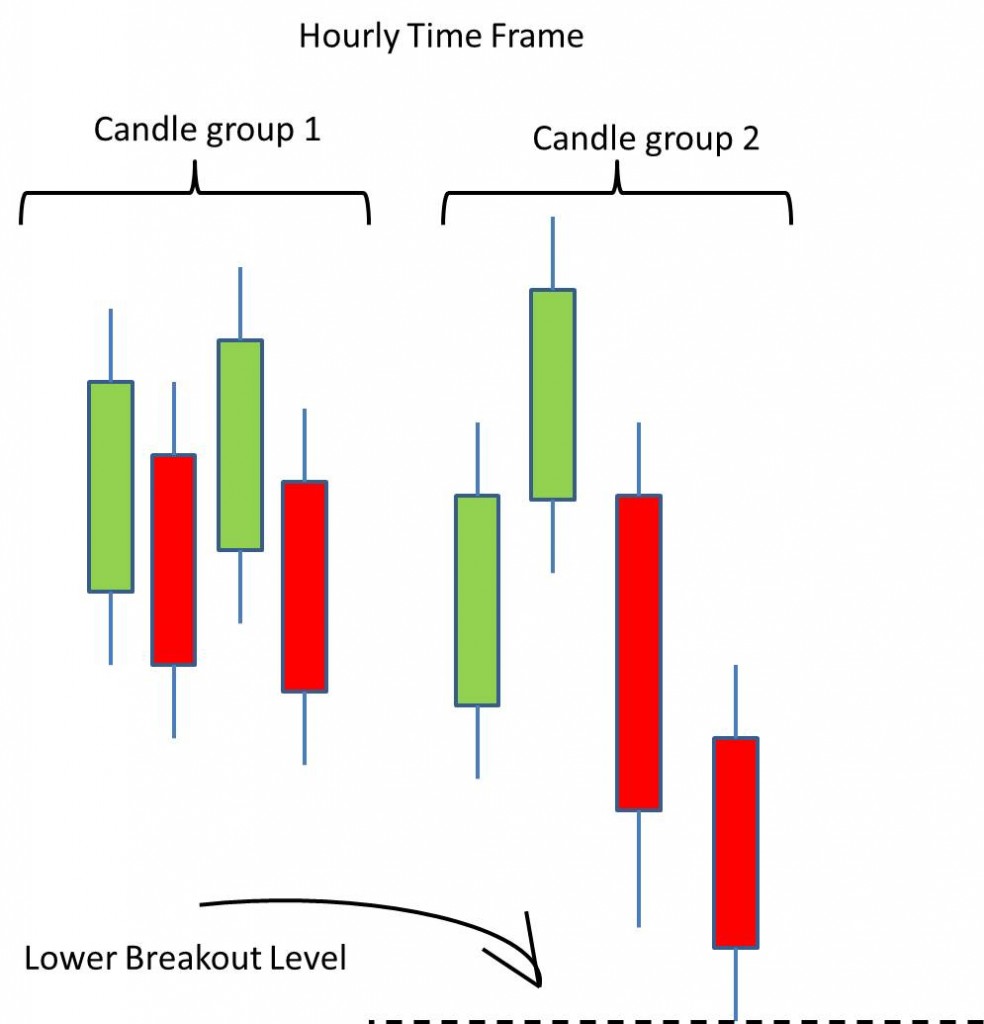
And the pattern we are specifically looking at is:
The choice of these four currency pairs is based on the fact their tight spread and liquidity. They are also the top trade by volume.
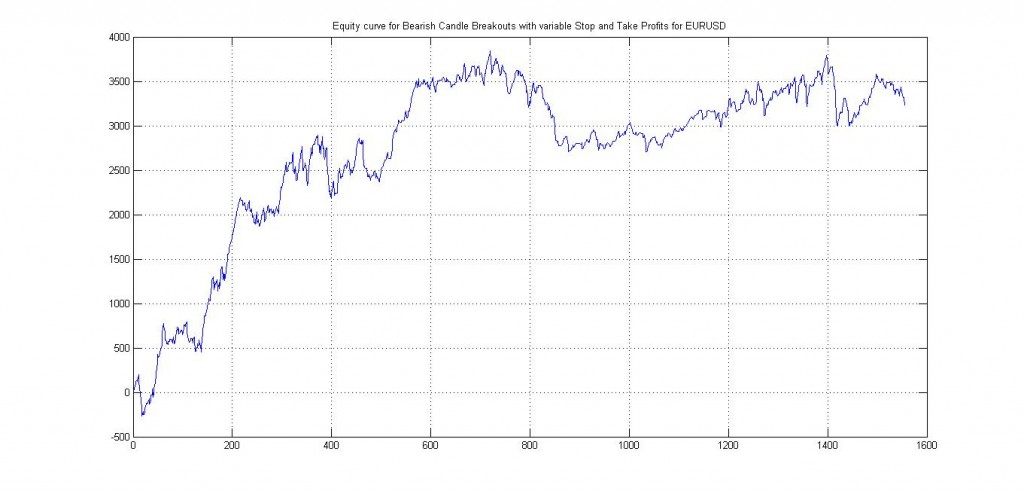
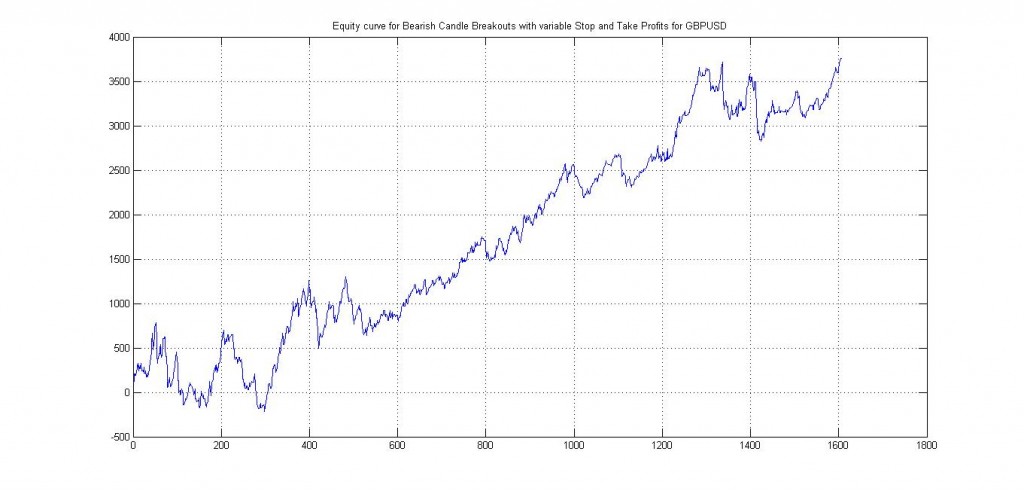
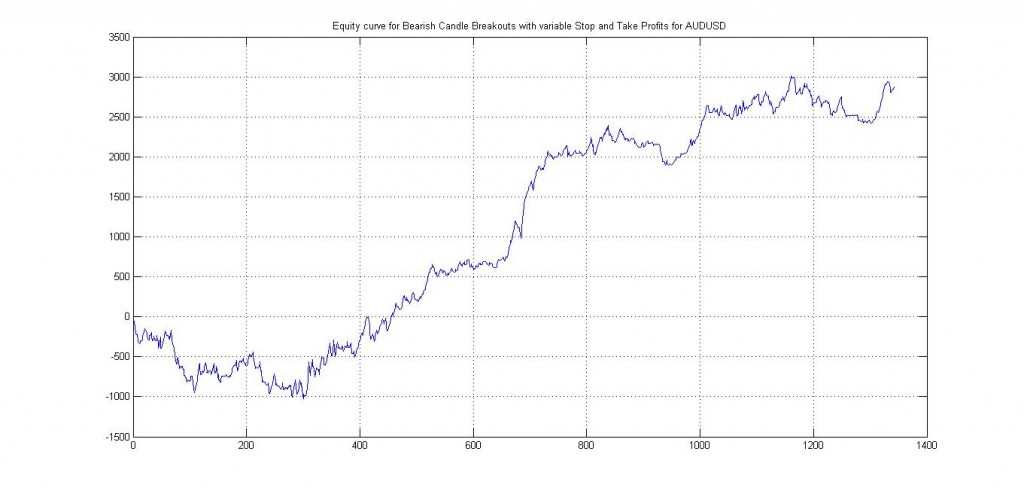
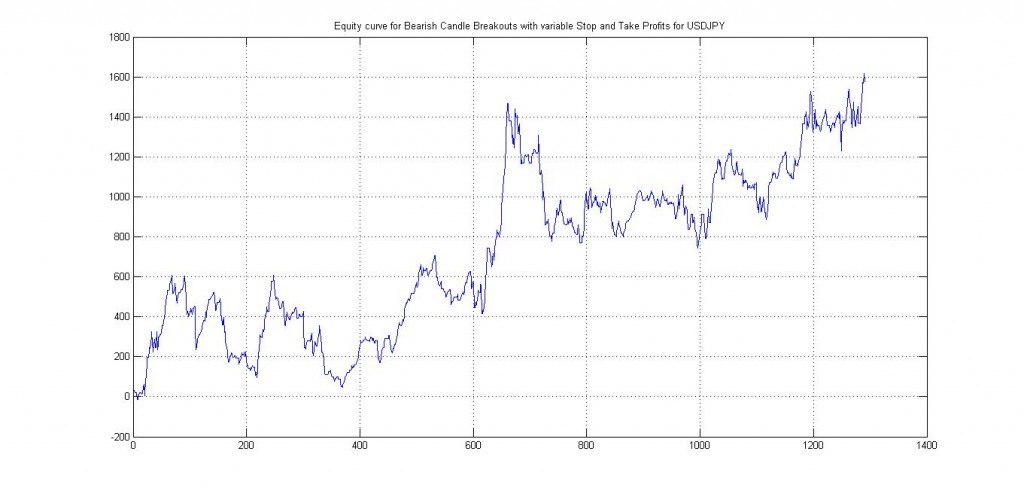
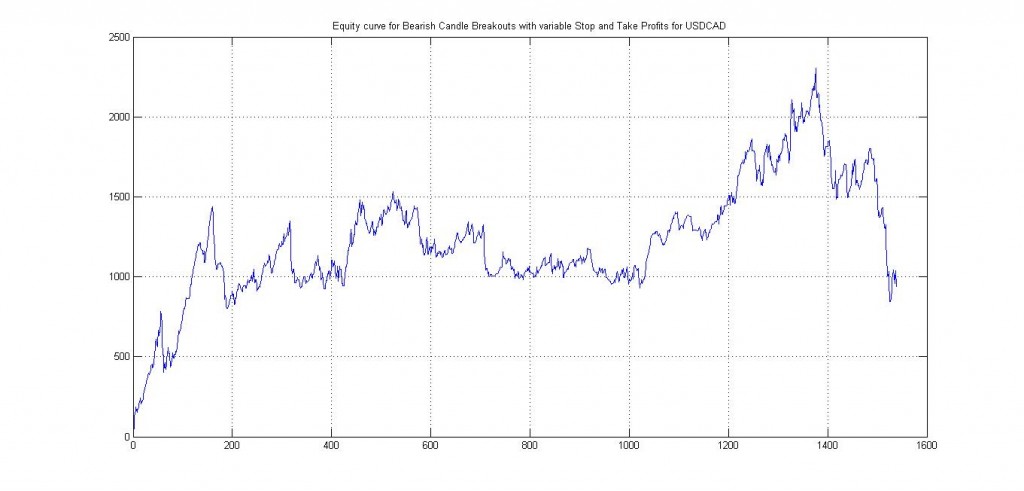
Here are the results for each of these currency pairs are:
EURUSD
GBPUSD
AUDUSD
USDJPY
USDCAD
To recap the trading rules for this setup:
- Identify the hourly rolling engulfing bearish candlestick pattern
- Set up a sell order on the minimum of the engulfing candle group
- Stops are at twice the height of the engulfing candle group
- Take Profits are at half the height
- Keep the trade on for 12 hours from the end of the pattern
In conclusion we now have a series of approaches to both the long and the short side of trading the engulfing candlestick pattern on an intraday basis.
The next step is to put these 10 P&L streams together (that is long and short for five currency pairs) and observe what the resulting overall P&L curve looks like.
As always when trading patterns such as this the most important question a trader can himself is: how confident am I that it will persist.
The fact that it is stable amongst various currency pairs, is an indication that there might be something to it. But what is the actual mechanism that drives the P&L, and is it the same across time frames, and how related to hourly time frames is it?
If we schematically draw out the price behaviour we are looking for it looks like and expanding range:
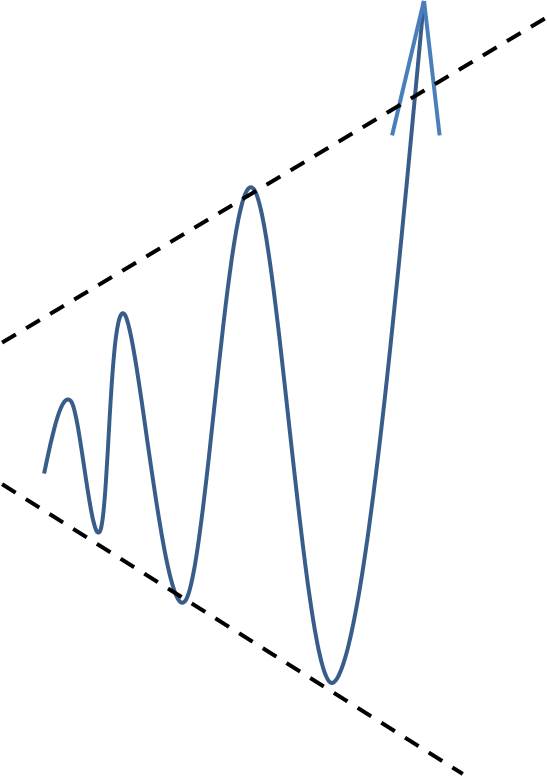
This is reminiscent of what people label an expanding range, and therefore our strategy for identifying such expanding ranges and trading the continuation out of the range can be labelled a volatility breakout strategy.
The way the engulfing candlesticks try to encode this pattern is by breaking it up into chunks and checking for expanding ranges.
So what is the premise that drives the profitability of this strategy?
Qualitatively it can be described as situation in which buyers and sellers are trying to establish a new equilibrium price, and as this is happening, the oscillations in price get wider and wider, and more and more volatile. We are trying to capture a specific leg of such a move.
The main reason for focusing on hourly time frames (other than to satisfy those of you who are heavily into day-trading!) is to be able to overcome the friction that naturally exists in the market over shorter time frames.
Who of you have entered a day trade, only for it to take hours to show even a 10 pip profit, every so often hopping 5 pips against you, and you’re thinking watching paint dry is a more pleasurable experience than watching your P&L go nowhere fast. (It’s turning out to be just such a day today and the ISM Manufacturing PMI numbers didn’t add any spice to it).
So what is the driving P&L factor for this system? As with any breakout strategy it will be movement. Therefore the art of day-trading really lies in being to identify catalysts that will engage the market in one direction or another. Unless you want to be chopped to pieces.
You find the indicator that will allow you to identify these engulfing bars is here. Try them out and see if you can formulate a system for yourself that adds to your bottom line. Feel free to comment any results you achieve!
If you’ve enjoyed this article sign up to my newsletter and follow me on Twitter!

Very interesting technique. Thank you for sharing.