The London Breakout Strategy falls under the category of Open Range Breakout as developed by Toby Crabel. In this article we’ll look at some results with regards to this strategy, as well different ways of trading it.
Let’s start out with the notion of Open Range Breakout. The key concept behind this strategy is that the range set at the start of the day sets a neutral zone for the rest of the day. If price moves either side of this range it is a strong indication that price will want to continue in that direction.
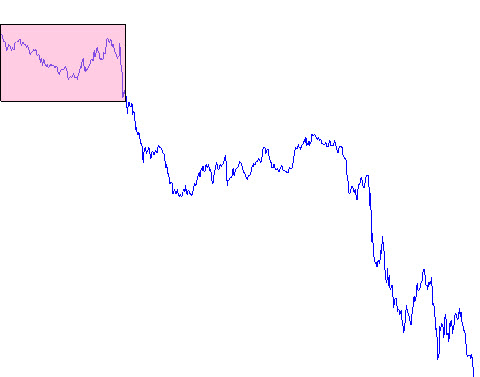
Here is a diagrammatic representation of this setup:

The shaded region indicates the initial range of the market open. The justification for this type of trading is based on following observation: the frequency of highs and lows for the day tend to be highest during the opening range.
There is a caveat to this observation: this is equally true for random markets! If you model the markets with a Geometric Brownian Motion you will find that the highs and lows tend to cluster at the start and the end of the day. It’s the nature of random movement to cluster its high and low points at the start and the end of the time period. You need to control for this clustering of highs and lows to determine if the market you’re considering shows abnormally high concentrations of highs and lows at the start of the trading period. For currencies, it turns out that we don’t need to take this into consideration.
So if we are correct in assuming that highs and lows tend to cluster around the opening of the day, it means that we stand a good chance of capturing a trend if we somehow get on-board in the right direction.
That is the point of the Open Range Breakout (ORB).
Toby Crabel made this approach famous and Mark Fisher used it as the cornerstone of his ABC trading approach which is outlined in “The Logical Trader.” You can find a link to this book in the Resource section of my site.
So what about currencies? They trade 24 hours a day, and close only for weekends. Let’s have a look at the clustering of highs and lows during a trading day.

This chart plots the frequency of highs and lows since 2001 for EURUSD, where time is in GMT. As we expected we have the artificial spikes at 00:00 GMT. Much more interesting is the clustering around 7am GMT and 1pm GMT. These coincide with the London opening and New York opening times.
Note that this is a different measure from volatility. Usual volatility measures or tick-volume measures also indicate a flurry of activity around those times. However, the chart above shows the number of daily highs and lows for every hour of the day since 2001. The fact that they coincide is not a necessity! But it meshes nicely with the picture we expect.
So our approach to ORB for currency markets is to define the opening time as 7pm for the London Opening. We can repeat the exercise for the New York opening, however, for a variety of reasons the London Opening is more profitable, so in this article we’ll just focus on that.
We can then take a specific time span to monitor the range (which would be the pink shaded region in the figure above), and use stop orders to trade the breakout either side of the range. For this article we’ll choose a one hour time span. So we monitor the markets from 7am to 8am and the highs and lows of that price range determine the levels of the buy and sell stop orders. We will use protective stops on the opposite sides of the range.
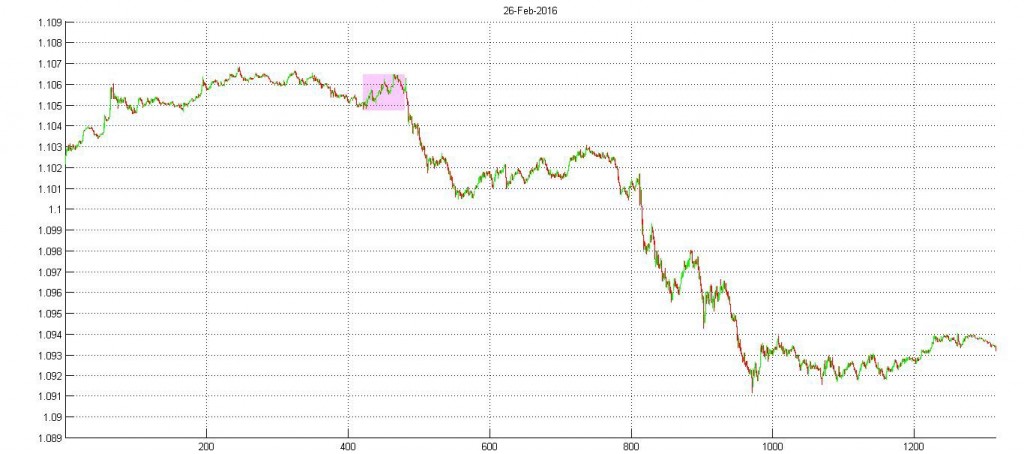
Here are a couple of examples for EURUSD. The first one shows a really nice break in one direction which happened on the 26th February, 2016, and was driven by the preliminary USD GDP numbers which came in much better than expected.

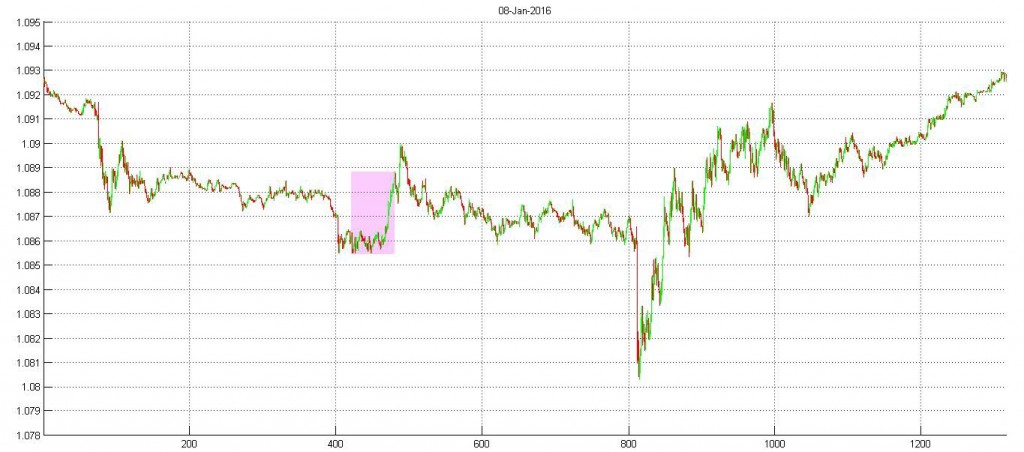
Of course for every beautiful picture like that you also have a choppy day. For instance the 8th January 2016 was a day that got chopped by the Non-Farm Payroll releases.

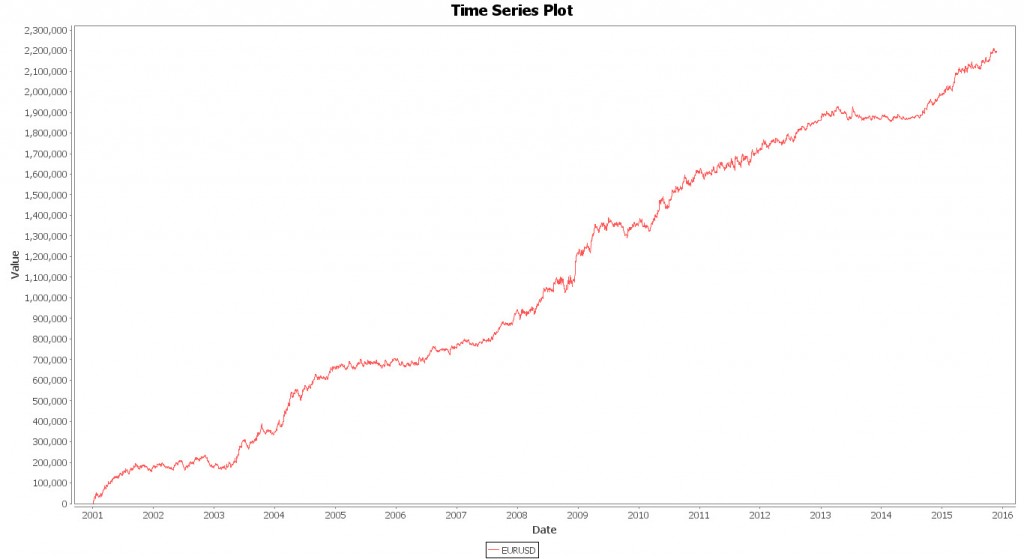
So armed with this strategy, let’s backtest it! The data used is the minutely free data from Forexite as published on the ForexTester site, which spans the range 2001 until the end of 2015. You can find the link on my Resource page.

The performance is steady. However, the P&L flat-lined from the middle of 2013 to the second half of 2014. Why?
One thing did happen in 2013 which lasted through to 2014: fallow volatility. EURUSD at one point in the summer of 2014 was only moving 40 pips a day.
This observation is key to breakout systems. Breakout systems don’t make money without movement. Movement is measured by volatility, another way for saying that markets swing. In markets that don’t move any kind of momentum strategy will be chopped to pieces.
It turns out that we can make this statement more precise for the EURUSD strategy above. In markets where the average daily range is less than 100 pips, we can expect to be chopped to pieces by swings either side of the opening range.
How does that help us? Well, for starters volatility regimes are persistent. There has been a lot of study with regards to this topic, and a lot of evidence points to the fact that high volatility days are followed by high volatility days and low volatility days are followed by low volatility days. So if we can find any catalyst that will activate the markets, that is the perfect time to run this strategy.
Another interesting observation: 2013 to 2014 was also a bad year for trend-following funds. Momentum seems to have ebbed away on every time scale, form intraday strategies such as this one, to trend-following strategies with holding periods of weeks and months.
This approach is purely pattern based, and some of you will naturally ask, why? Why should it work? There are some reasons, mostly anecdotal, from voice-traders working at Banks. The opening time of the markets is the period when most big orders come through (in terms of notional size: billions). It’s the voice-trader’s job to execute. He won’t do that in one clip. He’ll slice the order and job with the aim of filling the client on average at a decent price, but also my being opportunistic on the individual slices so that he can make a profit for his book. If all of a sudden price runs out of the morning range, he is left with an order that he has to chase, and he can’t afford to wait for price to come back. His order execution becomes more aggressive, and that will push price further out, creating the break in the markets.
As always, such anecdotal evidence needs to be taken with a grain of salt: it’s very difficult to test. On the other hand the fact that we found a market factor that correlates with strategy performance gives us a better handle on why we should currently trust the strategy, and how to keep monitoring it for ongoing performance.
If you want to delve deeper into breakout strategies across different time horizons, then have a look at my book on Kindle: Forex Breakout Strategies.
If you liked this article, then follow me on Twitter and subscribe to my newsletter below.


Hi nice article. Thank you. I have got 3 questions.
1. When or how you close position? On the and of the day, on specific TP?
2. How long buy and sell stop orders are valid? 60 minutes, 120 etc.?
3. Do you use OCO condition for orders or not?
Regards
Robert
Hi Robert,
Thank you for your comment. To answer your questions:
1) Close position at end of day. Slightly before 22:00 GMT is a good choice to avoid incurring swap charges.
2) The orders are valid throughout the trading day.
3) To be specific on the orders: you have 2 stop orders. A buy-stop order on the top side of the range and a sell-stop order on the bottom side of the range. They are independent of each other. So both sides of the range can be traded throughout the day. This doesn’t mean it is the most optimal way of implementing the strategy! Also, each of these orders if executed has a protective stop on the other side of the range. So the buy-stop if executed will have a protective sell-stop on the bottom side of the range. Same for the sell-stop order on the bottom side of the range.
Let me know if that makes it more clear.
Thx, it`s very clear.
why not bring the stop loss at breakeven when the buy or sell stop has triggered?
Hi Kamil,
That is a very good question. Yes, it is possible to add this type of trade management to the system. The idea is that once the trade has moved in your favor by a certain distance, you can ratchet the stop to breakeven. As always, this kind of implementation won’t make you more money, but it will make your P&L smoother, that is less drawdowns. Which then allows you to leverage more.
You have to play around with the distance that the trade goes in your favour. 20 pips might be a good start.