In this week’s article I cover the right approach to benchmarking your performance using the standard risk measures out there. In particular we’ll start out by outlining how the Sharpe Ratio relates to the usual performance measures such as Win/Loss ration or Return/Maximum Draw-Down ratios. This will allow you to see if you are on track or not, and adjust your trading accordingly.
The purpose is to put risk measurement into context and relate your trading statistics to optimal wealth accumulation, the ultimate goal of trading. What does all this have to do with Kill Ratios? It turns out that playing Call of Duty (or Battlefront, or any other First Person Shooter) has the same risk principles as trading!
First let me take a step back and ask this question: “Why do people choose to trade?” There are three possible reasons:
- An intellectual passion for the markets
- A career choice
- Constraint driven: need to make MONEY!
All of these put unnecessary pressure on the trader.
The first drives you to look for the “right” answer. It makes you forget that markets have a large random component. There is no way you can be “right” about randomness. It means that you will lose, and the losing trades will trigger a vicious cycle of chasing your tail, trying to find the Holy Grail of trading. The outcome is account depletion.
The second tends to drive people into market-making jobs, which are slowly being taken over by algos and machines. Those who end up in coveted asset / investment management decision making roles, such as portfolio managers, end up playing the corporate game (exploiting the bonus option, and circling around hedge funds).
The third is the most difficult of all, as you find yourself caught in pie-in-the-sky territory. The biggest issue with this category is that there is no tangible yardstick by which to measure your performance. On the one hand you are told that making money consistently every month is your goal, on the other you are told to control losses, use stop-losses, and as the losing trades accumulate, it becomes ever more difficult to see how the value of your portfolio will increase.
All of these reasons have little to do with trading per se. The real goal to trading is to make as much money as possible. And the only way to know if you are on track with your approach is to understand how to measure your performance relative to the risk you take. So forget about the intellectual satisfaction of figuring out a trading strategy, or getting into a stressful trading career, or trying to get rich quick and get back to basics and realistic assumptions.
This article sets out to create a framework against which you can set your trading expectations. Of course I’m not going to rain on your parade, and I keep saying that having 100% return years is possible. The key question is how much are you willing to risk for it?
Let’s put the risk question within the context of First Person Shooter games, especially the online-gaming mode. It’s an internet subculture that I have been recently introduced to by my son. Interestingly they have their own performance measures called Kill Ratios or KRs (it could have been called Risk Ratios instead). To get your KR you divide the number of antagonists you have disposed of by the number of times you had the misfortune of being dispatched. It’s similar to the Win:Loss ratio or Profit:Loss ratio or even the Sharpe Ratio, where you divide your gains by your losses.
It turns out that a KR between 0.8 to 1.2 is considered “good”. Above 1.5 you’re excellent, and above 2.0 you walk on water. Below 0.8, you still stand a chance, but need some improvement, and below 0.5, you might as well do something else.
I found these numbers remarkable, as the ranges correspond exactly to what the usual ratios tell you about your performance as well, especially the Sharpe Ratio.
So how does this come about?
It’s all again about risk. The aim of a First Person Shooter game is to collect your hits, without being shot yourself. The only way to do that is by seeking cover. If you go in guns blazing, some hidden enemy or sniper will take you out.
The markets are exactly the same. Going in guns blazing, using too much leverage, and not formulating a strategy will ultimately result in many more losses being swallowed than necessary, and the outcome is a constant depletion of your capital.
So what is the right approach? What kind of risk should you employ? How does this relate to Sharpe Ratios?
To make all this clear we’ll take following approach:
- Give an intuitive explanation of what a Sharpe Ratio is
- Have a look at what the pro’s achieve
- Translate all this into the usual Win/Loss ratios, Hit Ratios and Profit/Loss Ratios so you can see how it applies to your trading
Why start with the Sharpe Ratios? Because you can EASILY find what they are for almost any asset or fund out there.
A Sharpe Ratio is formally defined as Return divided by Risk. And this number is formulated to give you an annualized overview. The idea is to give you an idea of how much you can expect to make over the period of a year, and what the chance of actually achieving that target is.
Here is a table outlining, what the probability is for a positive year, given a number of Sharpe Ratios:
| Annualized Sharpe Ratio | Probability of Positive Year |
|---|---|
| 0.5 | 69.1% |
| 1.0 | 84.1% |
| 1.5 | 93.3% |
| 2.0 | 97.7% |
So how does this compare to the various investment opportunities out there? Let’s take opposite sides of the spectrum. Below is the SPY ETF versus the Hedge Fund Research Index from 1993, which is an aggregate return index of a large part of the Hedge Fund universe. That is, we are comparing a naïve buy-and-hold strategy versus active management.
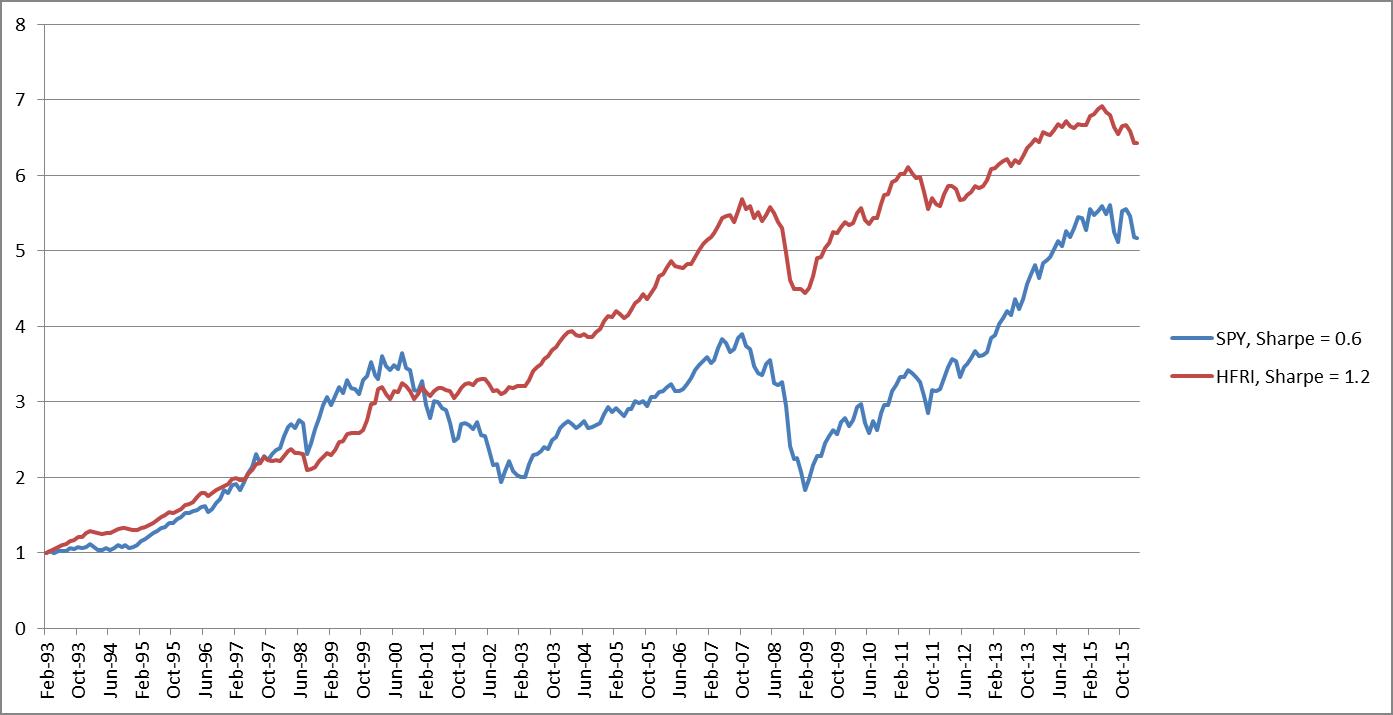
The Sharpe Ratio for the SPY ETF is 0.6, whereas for the Hedge Fund Index the Sharpe Ratio is 1.2 over this time period. As I keep on saying, you don’t need magic to make money, and as you can see even the investment industry is losing its magical touch.
So, for the sake of argument let’s say that a Sharpe Ratio of 1.0 is suitable for our needs. (How do you achieve that, easy: look at my Trading Approach for FX).
Let’s see what this means in terms of your trade ratios. For starters it means that you can expect to have a losing year every 6 years (using the probability table above).
What about the other performance measures which you can extract out of your trade log: Win/Loss ratio, Hit Ratios and Annual Return to Maximum Draw-Down (MAR)? Following are the results for trading strategies of varying time horizons:
| Daily | Weekly | Monthly | |
|---|---|---|---|
| Hit Rate | 53% | 55% | 61% |
| Win/Loss Ratio | 1.07 | 1.15 | 0.6 |
| MAR | 1.2 | 0.8 | 0.6 |
A couple of points here: daily / weekly / monthly refers to the frequency of trading. Given that we imposed a year as our target date for measuring returns, it’s clear that the less frequently you trade the more often you have to be right and make more money on average (which is the Win/Loss Ratio). What is also striking is that the less frequently you trade the deeper your drawdown can be compared to your overall annual return. You can see this from the decreasing number on the Return / Max DrawDown ratio. The reason is that doing less trades, means being wrong can hurt you more often over a year. If you trade frequently, your hit rate should help dig you out of a hole quicker. Also the longer your holding period, the wilder your P&L swings.
The one thing that doesn’t come across in this table is the usual statement that traders have a low hit rate, maybe as low as 40%. The reason that is the case for some traders / trading strategies is that they really try to skew their returns by letting winners run like crazy, and kill their losses fast (e.g.trend-following strategies). The numbers above were derived from simulations of simple portfolios which you can construct from standard indices such as Bond indices, Equity indices, or the FX Benchmark. This approach to trading doesn’t care much for trends, just the likelihood of getting the direction right.
It’s now up to you. Take out your trade logs and check if you get similar statistics to the above numbers. If you do or you are close enough to them (and for that make sure you check the column corresponding to your trade frequency), then you are on the right track.
If not, you need to revisit your approach.
If you’ve enjoyed this article follow me on Twitter and sign up to my newsletter!

Hello Corvin,
Forgive me if this question comes across as a bit elementary but you describe the Sharpe ratio as Wins/Loss or Profit/Loss. I interpret the former in pip-terms and the latter in money-terms which gives me slightly different results. I’m guessing that the latter is the way to calculate my Sharpe ratio as calculation in pip-terms is unable to take into account the variation in risk taken for each trade.My confusion has arisen from your definition further on in your article which states it is formally defined as ‘Return divided by Risk’.
Just to give you an idea of what I think it is, please allow me to illustrate an example with 5 trades.
1. -£20
2. +£50
3. £0 (breakeven)
4. +£45
5. -£35
The Sharpe ratio of the above is (50+45)/(20+35)=1.46
Please let me know if I am on the right track in my understanding of the Sharpe ratio.
Many thanks for illustrating Sharpe ratio with my example on TipTV Finance
https://www.youtube.com/watch?v=TL8gYB_EVgg
Absolutely comprehensive and more!
Hi Stuart,
I thought your examples was very good for highlighting what people usually come across. Thank you for watching!