In this post I want to cover one of the factors that enters into the creation of the benchmark index outlined in my Trading Approach. This factor is called Value, and provides an underlying fundamental reason for trading various currencies.
To explain value let’s assume that the water company Evian sells an identical bottle of water both in the UK and in the US. These two bottles are identical. Same water, same glass bottle, same label, same everything. In essence a tourist from the US could come to the UK and exchange one bottle for another without anybody disagreeing to value!
Now let’s say that the US price of 1 bottle is $1.30, and let’s say that the price of one bottle in the UK is £1.00. So the actual exchange rate GBP/USD according to these equivalent bottles is 1.30 (the US price divided by the UK price).
Now let’s go into the market. The exchange rate is 1.45.
Why aren’t the two values the same? In both cases, by exchanging two identical bottles from two countries or exchanging cash, I should come up with the same exchange rate.
No.
There are various reasons: for instance Evian is a French company, and so maybe transportation costs to the US and the UK are different, which factors into the mismatch of the hypothetical exchange rate.
Regardless, it turns out there is still a value mismatch. And just like in equities where people have the notion of value stock and a value trade, the value trade in this example is to short GBP/USD until it hits its value of 1.30 as determined by real goods in the real economy. The exchange rate is a market aberration.
The way to trade this across the universe of currencies is to establish the value of each currency and then on a monthly basis figure out which currencies to buy and which currencies to sell.
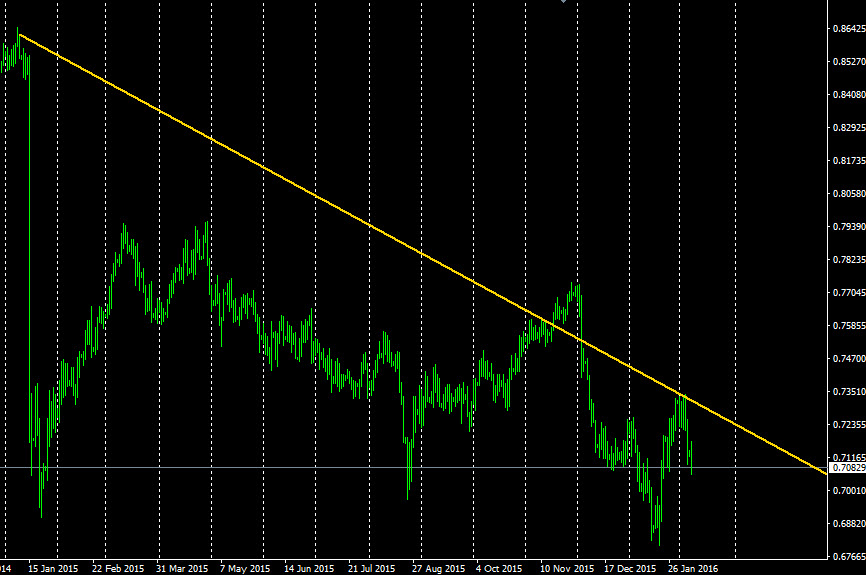
For most of 2015 the value trade has been short CHF versus long JPY. That trade took right off in the second week of January after the SNB removed the EURCHF floor, however throughout the year, timing the price action right, would have milked the trade several times over.
If we pull up the CHFJPY chart:

So how do we determine the values of these currencies?
For starters these value exchange rates are called Purchasing Power Parity values (PPP). And they tend to be quoted against the US Dollar, as it is the ubiquitous currency, and US is the biggest importer of goods.
Several international organizations calculate these PPP values. We will use the numbers from the OECD. These numbers get published at the start of every calendar year. Since they are only published once a year, does it mean that these don’t change throughout the year? Well since they represent the value of goods, and the prices of goods change due to inflation, we would need to adjust these numbers by the relative inflation rate of the two countries forming the currency pair.
However, inflation rates are at present historic lows, and so these adjustments won’t make much of a difference (at least for now!).
We obtain the PPP numbers from the OECD website.
We list the newest values and the actual market rates (as of 8th February 2016). Note that all values are quoted with the USD as base currency (so for instance USDEUR rather than EURUSD):
By taking the ratio of the PPP rate versus the market exchange rate we obtain the Real Exchange Rate (RER), which should equal to one if the market rate equaled the PPP value. A RER that is above 1 means the currency is overvalued. A RER value that is below 1 means that the currency is undervalued. Ordering them according to the RER we obtain following table:
| Currency | PPP | Market Value (USD base) | RER |
|---|---|---|---|
| USDEUR | 0.7608 | 0.8929 | 0.8521 |
| USDCAD | 1.2195 | 1.3920 | 0.8761 |
| USDJPY | 106.04 | 115.70 | 0.9165 |
| USDNZD | 1.4208 | 1.5083 | 0.9420 |
| USDGBP | 0.7003 | 0.6930 | 1.0101 |
| USDAUD | 1.4444 | 1.4104 | 1.0241 |
| USDSEK | 9.0270 | 8.44 | 1.0695 |
| USDNOK | 9.1691 | 8.57 | 1.0700 |
| USDCHF | 1.2919 | 0.9870 | 1.3090 |
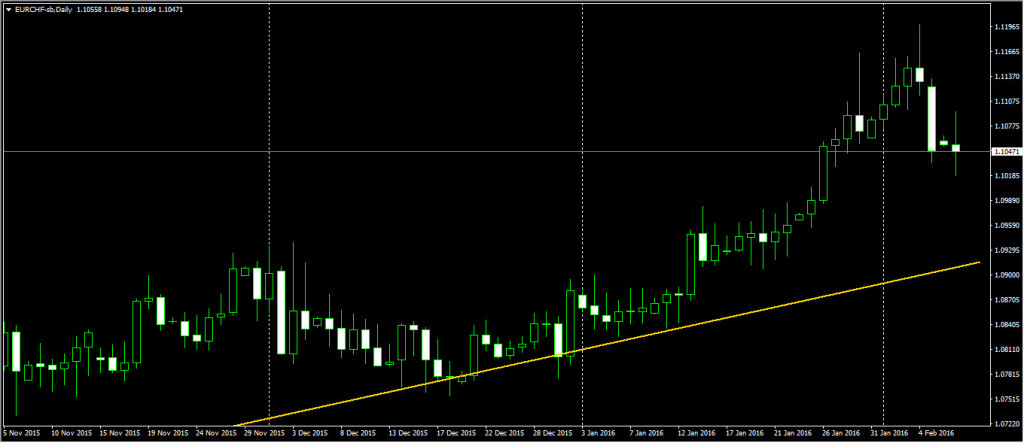
So the cheapest currency is the EUR and the most expensive is the CHF. So the value-trade would be long EURCHF. That is we sell the most expensive and go long the cheapest currency. In essence this is a relative-value trade, and it has to be, since currencies always come in pairs!
Here’s a recent chart of this currency pair:

One possible way of trading this dynamically is to repeat the process on a monthly basis. Obviously the PPP values will remain unchanged throughout the year. However the exchange rates will oscillate. This is due to the vagaries of Mr. Market as Warren Buffett likes saying.
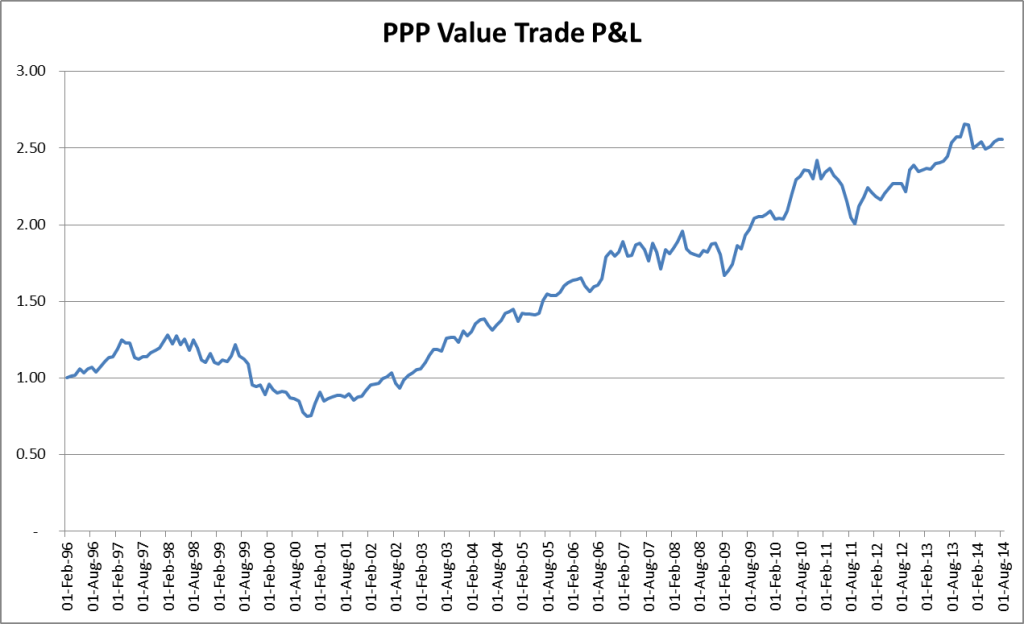
The performance of just this factor by itself over the last twenty years looks like this:

Happy Trading!
If you’ve liked this post please follow me on @FXMasterCourse or sign-up to my newsletter.


This is truly an eye opener.
Thank you.
Wayne
Wow great article
Thank You very much
Kamil
this is very useable for the traders, thank u very much
Would this explain (sort of) why the December spike in the euro, allegedly due to ineffectual stimulus by the ecb, was simply the euro pushing back toward its real market value? In other words, the ecb is beating a dead horse. Rather trying to let the air out of an already flat balloon.
Hi Jim,
In a sense yes. The theme here is “currency war,” which has been discussed for a very long time now amongst market participants. And this in effect has been fought with lowering rates. And a weak Euro definitely benefits exports, and helps import inflation into the Euro Zone. So any disappointment in the easing/hiking cycle Central Banks implement, will take the short term pressure from interest rates off the currency, and let the currency go back to its longer term equilibrium, i.e. “value”.
You can see this off the back of the ECB rate announcement today, 10th March. 400 pip bounce off the 1.08 level, after Draghi indicates that his easing cycle is done. PPP being at 1.24, should signal a longer-term buy here. Let’s see what happens.
As always, however, value is not the only factor. Over long periods of time, it definitely comes into play strongly, just like with stocks. Therefore it’s good to trade a basket of undervalued currencies versus overvalued ones. Similar to creating baskets of undervalued stocks, to diversify risk.
Very useful article. It would be useful if you can provide an excel sheet which can update the values.
Thanks
Hi. This is really useful but I wanted to bring to your notice a few things. The problem with the OECD data is that its history is constantly revised. Based on that information would you still believe that this backtest is unbiased?
Have you backtested this strategy using unrevised data. Would it still yield such strong results. Further do you think it will help if we update each month with the CPI print.
7. When are PPPs updated and revised?
PPPs for a given year T are published in five steps:
At T+2 months: first PPP estimates, for GDP only
At T+6 months: second PPP estimates, based on detailed extrapolations, for GDP, households’ Actual Individual Consumption (AIC) and Individual Household Consumption (IHC)
At T+12 months: third PPP estimates, incorporating all price and expenditure data for year T
At T+24 months: fourth PPP estimates, incorporating updated expenditure estimates
At T+36 months: final PPP estimates for year T
In other words, the following results for GDP, AIC and IHC were published in December 2016:
Final results for the year 2013
Fourth estimates for the year 2014
Third estimates for the year 2015
In February 2017, first estimates for the year 2016 were published, second estimates will be published in June 2017.
Please note that in December 2016, PPP data from 1995 to 2012 were exceptionally revised for all European countries. Further information on this revision is available on the Eurostat website.
PPP data from 1970 to 2012 may be revised in December each year in order to incorporate revisions in National Accounts’ deflators. More information on historical time series is available in the following note.
Hi Harry,
Thank you very much for the breakdown in the revisions!
No, the backtests have not been re-done controlling for the revisions. Over the last year I have kept track of revisions, and the sizes of revisions observed are not of sufficient size to change the order of the currencies.
So in essence, given that we are looking for an order (ranking) of currencies, rather than using any implied calculation results from the actual PPP numbers, the question is how much the revisions actually impact the ranking from the RER value. Given the previous years observation (admittedly a very short time horizon, with low or negligible inflation) it seems that the ranking is unaffected.
However, one frustrating thing has been that revisions are (at least on the OECD website) not readily available (hence the realtime tracking of these). Thank you for pointing out the Eurostat revisions, though one thing still not clear to me is the methodologies amongst the various institutions who publish PPP. E.g. IMF, World Bank, OECD’s numbers aren’t necessarily all the same.
It looks like you have experience with this approach, so if you have any guidance with regards to obtaining the revisions, or if you have tried out various different approaches to implementing PPP please let me know.
Thank you again for such a detailed response!
Hi there,
Interesting article. Do you have a way to automatically download the currencies and PPP so that you can track in real time?
Thank you,
Cristiano
Hi Cristiano,
Thank you for your comment!
The PPP could be web-scraped on a regular basis (bias towards Python here), however the numbers are updated infrequently (if I recall correctly at least every three months if not longer).
Throughout the year, other than updates to underlying goods or calculation methods, you’ll have inflation imposing a drift on the the PPP currency pair. However, with current inflation and inflation differentials so low, this drift is negligble. Hence, not much an update that these offer, compared to the market prices. As always, price volatility from fundamental factors tends to completely underestimate market price volatility.
The article focuses predominantly on G10, however with the PPP values available across a larger set, I’m tempted to go back now and look at those currencies as well.
Going back to the Python statement above, I think this would be a nice script to implement. It should be up in the next week or so.
Thank you for the suggestion!
Great, thank you. I am trying to backtest manually and see what happens.. keep us posted (info@integerinvestments.com)
Cheers,
Cristiano
Hello there. Did you ever code the script, or perhaps do you have an excel spreadsheet that updates the data automatically? If yes, can you share them please? Thanks a lot!
Do you still use this method for trading decisions? I am getting into forex fundamental analysis now, and whatever I can add to the puzzel to form a bias, the better.
Cheers
Hi Albert,
Not yet. This is a high request rate for this feature. I will put something together, and post it over the next week. The data source for the PPP itself is from the OECD website. However, they do update the numbers on a quarterly / bi-yearly basis, and do not provide these historical numbers. The changes are small, but can impact back-testing. So it is a good idea to scrape their site on a regular basis and store in time snap shots (as well as other providers as well, how perform their own PPP calculation.
Thank you for getting in touch!