
I’ve written several articles on what happens during news announcements, and associated quick trading strategies. But from a regular trader’s perspective, surely there must be another way to approach these things.
In this article I’ll given an overview as to how to trade these news announcements in a slightly more leisurely way, and see if there is anything to be had out of trading against market hysteria. The instrument of choice will be the EURUSD, though you can pick any other instrument that should be sensitive to USD news, for instance USDJPY. And the news announcement we’ll be analysing are the NFPs, after FOMC announcements, the juiciest events out there.
The approach taken here is one that is quite common in equity trading strategy: “earnings surprise.” Of course currencies don’t have earnings (they have Central Banks instead), however for each economic announcement there can be some serious deviation from expectations, as well as revisions of past numbers.
Firstly some quick background on the NFP numbers. The Non-Farm Payroll numbers are part of the Employment Situation. The NFP numbers are also called the employment survey. Unlike the household survey which is used to establish the unemployment rate, the employment survey gathers information on the job market directly from business establishments. The BLS gets in touch with 400,000 companies and government agencies. These employ more than 40 million workers. It includes all persons on the payroll of non-farm business, non-profit groups, and local, state, and federal government offices. Even residents of Mexico and Canada who travel to their jobs in the U.S. are counted. The workers excluded from the establishment survey are farm workers, the self-employed, and domestic help. Given that many of the business are small and not very good at paperwork, and the large number of businesses surveyed, only 60% to 70% make it by the initial reporting deadline. A further 20% make it past the monthly deadline, and these numbers form the basis for any further revisions.
So how are the NFP numbers important to currencies? They measure the current state of unemployment in the US. And unemployment is very closely correlated to aggregate output, in other words GDP. A model that describes this close correlation is called Okun’s law, and shows that unemployment is directly related to GDP growth.
A crucial factor that enters into Central Bankers’ consideration when looking at how to set interest rates is the relationship between long-trend GDP growth rate, and the current production output. The difference between these two numbers is called the output gap, and tells you if the economy is underutilized, i.e. there is slack in the economy, or if it is overheating.
This output gap is one of the key ingredients in setting interest rates. If the output gap is positive, i.e the economy is running at hyperspeed, interest rates should go up. Vice versa, if the economy is underutilized, interest rates should go down to stimulate it.
Janet Yellen gives an overview in her speech on March 27, 2015 on Okun’s law the output gap and how these feature in her rate policy decisions via the Taylor Rule (footnote, page 7).
Any deviation from the current status quo, will therefore lead Central Bankers to alter their policy. And the job of the market is to second guess their upcoming policy decisions.
So if the surprise in the NFPs is strong and positive, we’d expect interest rates as set by Central Banks to trend upwards and hence induce a stronger US Dollar, whereas downside surprises would suggest a downtrend in interest rates and therefore a weaker US Dollar.
So what shall we look at in particular? Following are the three factors:
- Month on month changes
- Surprises in the announced number versus expectations
- Size and direction of the revisions to the prior month
We’d expect (1) to be a weak indicator by itself, as the NFP numbers are backward looking for the previous month, and weekly unemployment claims, as well as other economic indicators should provide a could forecast for (1). (2) however starts to become more relevant, as it represents an exogenous shock due to unknown information. Markets are not the best at re-pricing information instantly, and so the process of absorbing this surprise tends to present trading opportunities. And finally (3) is really an indication of how wrong we got it last time. Clearly a current surprise, as well as re-painting the past should lead to more pronounced moves.
So how do we trade this information? For starters we’ve seen in previous articles that NFP numbers can have quite an impact on the market, leading to many brokers either widening the bid/ask spread, or complete quote outages, depending on what broker you use.
So for the purpose of testing we will simply enter a trade on NFP day 15 minutes after the announcement. And hold it until close of business (which in our case is 00:00GMT).
All that’s left is to determine directionality.
Here are the three methods that we’ll test:
- Trade in the direction of the month-on-month NFP changes. So if we had an increase in NFPs, go long the USD, if NFPs decrease short the USD.
- Incorporate surprises and revisions. We’ll do this in an additive way by defining the variable we observe as:
(This Month’s – Last Month’s NFP) + (Actual – Forecasted NFPs) + (Revised – Previous NFPs)
If this variable is strong and positive go long the USD. If it is weak and negative go short the USD.
In both these methods we will actually trade at 15 minutes past the announcement and hold until end of day.
The final and third approach will be to state (as you can see from most charts) that the markets tend to by hysterical. There was a great survey done a couple of years ago of the main FX Dealers in the City of London, which showed that they believed crowd-behaviour and market hysteria to be a main driver for intraday price. So how do we exploit this? Simple: take the variable we defined in (2) and simply fade the move. But this time we’ll hold the position until the close of the next business day (which usually tends to be Monday, as NFPs, barring holidays, are released on a Friday).
So what do the results look like?
Let’s start with (1). Here is the result of the NFP month on month changes versus price moves from 15 minutes past the announcement until end-of-day:
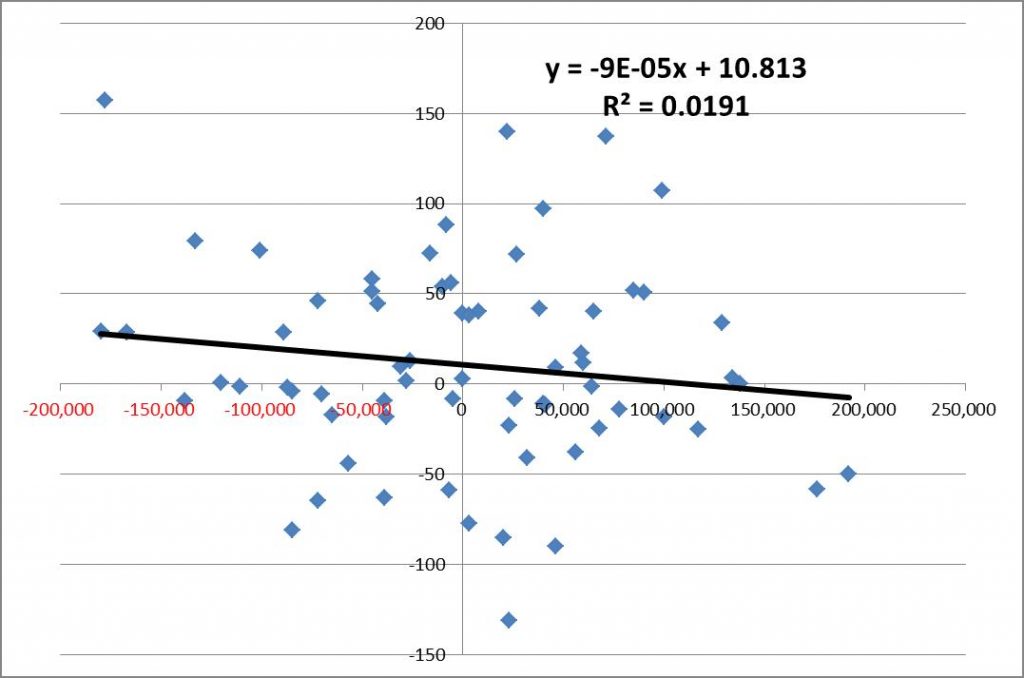
This chart shows that when you have strong positive NFP numbers EURUSD tends to sell-off on the day and vice versa. This is to be expected as a strong USD means a downward move for EURUSD and a weak NFP reading gives a weak US Dollar and EURUSD moves up. This is represented by drawing the regression line, which indicates a 1 pip outcome for each 10,000 reading. The R^2 which is a measure of goodness of fit is only at 1.9%, however, given the nature of intraday financial time-series this is isn’t too bad.
So what does the P&L look like for a strategy such as this?
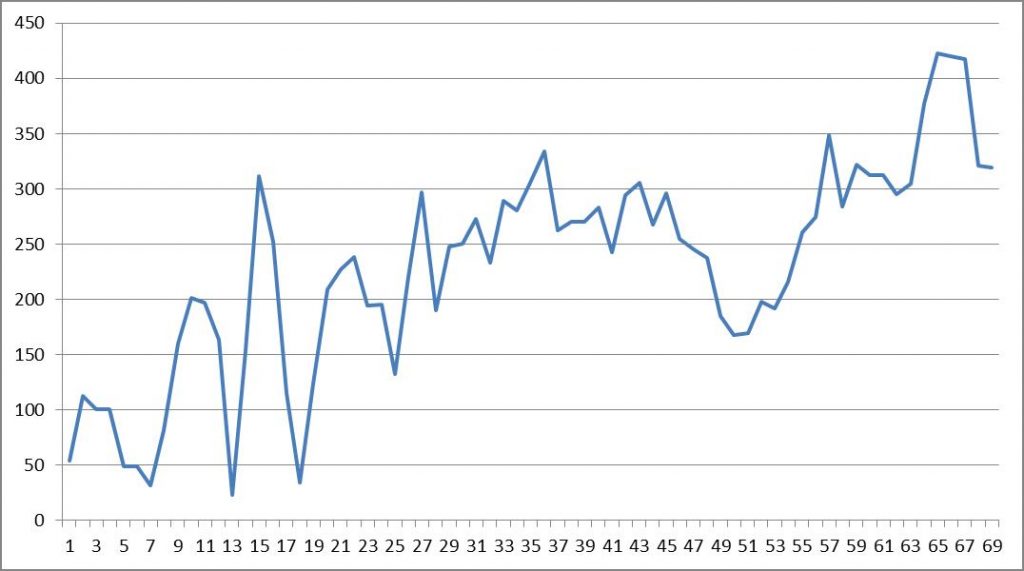
I’ve backtested the strategy over a period of 6 years, going back to 2010, which makes for roughly 72 readings. There is certainly some juice in it.
Could we do better?
Let’s move on to method number two, and see if we include surprises and revisions the P&L becomes better.
This time round:
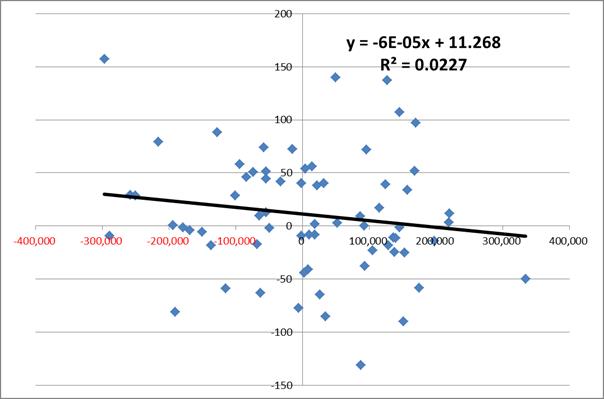
The goodness of fit measure R^2 has improved, which means that our strategy should capture outliers better. Let’s have a look:
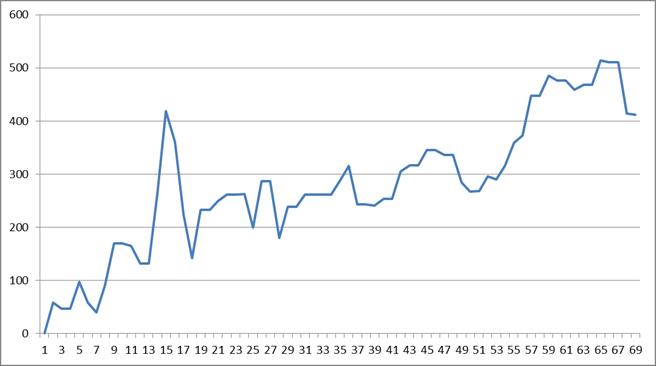
The P&L is definitely smoother. So there is something for trading news events by interpreting both the underlying economics and taking short-term market hysteria into account.
Ok, so what about fading all the crazies, once the numbers come out, as we suggested in the third method. Just to repeat: take a look at the month on month changes, surprises, as well as revisions, and trade in the opposite way to what we’ve just discussed. The assumption here is that market goes bananas, and then unwinds itself. Of course, this might take slightly more time, so rather than holding it until the end of Friday, hold it until the end of Monday.
Here is the result for that strategy:
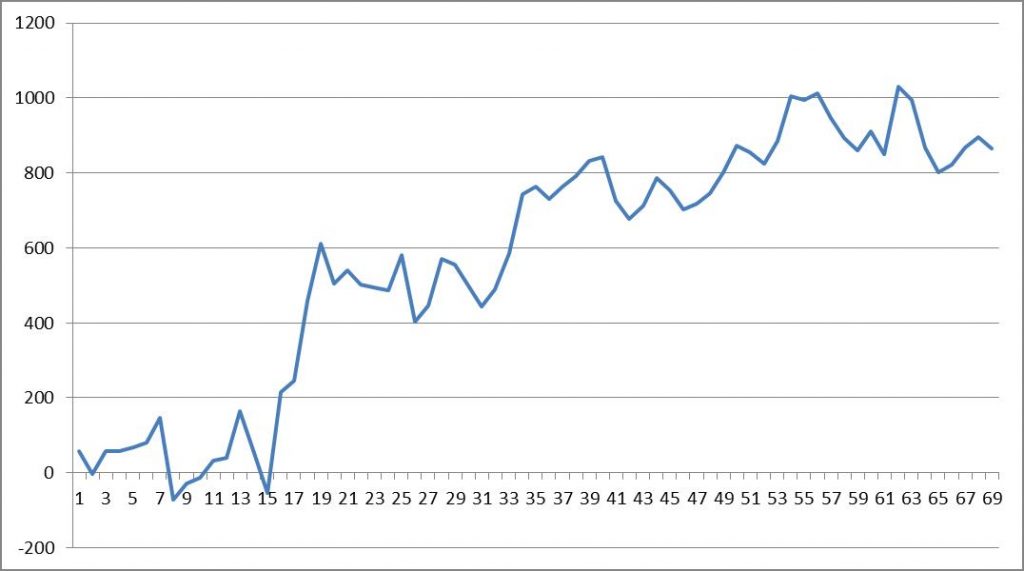
Now this is completely different. It makes more money, and is definitely smoother.
This analysis of course can be performed on other relevant announcements, and other currency pairs, though the US Dollar is the most watched.
Data
By now I’m certain you’re dying to get your hands dirty and try this out for yourself. All I can say is: data, data, data. I know of very few data vendors who (except maybe Bloomberg or Reuters) who would provide this news data. Even less free data vendors. But there is thank God one free website that comes to our rescue: ForexFactory.com! If you’ve ever played around on their news announcements page you will know that they provide actuals, forecasts, and revisions. To extract that information, especially the historical data (which goes back to 2007), you need to screen-scrape it. I’m attaching a little python script here that will do exactly that for you. As you can tell this is aimed at the programmers amongst you, otherwise it’s not doable. And Python is something most can definitely pick up.
With regards to intraday data, my favorite source is listed under Resources, the ForexTester intraday data, which I’ve been using for most of my testing.
Now it’s up to you to find more such patterns.
Happy trading.
If you have enjoyed this post follow me on Twitter and sign-up to my Newsletter for weekly updates on trading strategies and other market insights!

Thanks for putting it in such simple terms…i finally feel im starting to understand the markets
Hi Michael,
Thank you for your comment! If the article gives you another tool in your toolbox that’s great! Markets are very fickle, and so any understanding needs to be taken lightly, since all of a sudden old patterns that seemed to work, won’t work any longer, and that usually happens all of a sudden.
As Bush said: “Fool me once, shame on – shame on you. Fool me – you can’t get fooled again.”