
Would you like to build consistently profitable trading systems from scratch?
This article series does exactly that. Here are the steps which we’ll work through:
- Define the underlying principles of a successful trading approach
- Determine the assets which obey these principles
- Determine rule sets for trading these assets
- Work out a straightforward portfolio construction method
That’s the theory.
In this article-series we’ll go a step further and look at how to implement and automate this process, in terms of instruments / brokers, as well as writing some Python funky scripts.
Principles of a Successful Trading Approach.
So, let’s hop in to the first part of this series: Principles of a Successful Trading Approach.
The point about principles is they act as a guide, keeping you on the right path. Most people pursue trading as a hobby, chasing shiny objects (viz. systems / indicators / expert-advisors), always lured by promises of big returns, never asking how these returns can be achieved.
However, some straightforward research goes a long way to show that keeping to the basics can reap big profits (google Buffett, Dalio’s All-Weather fund, even the good old buy-and-hold equity strategy makes money) in building consistently profitable trading systems.
So, what are these guide-posts? Here are the golden three:
Principle #1: Assets have biases. We simply have to figure out which assets have what bias.
Principle #2: We need to have a rule based approach to extract value. Why rule based? Why not just wave our hands and interpret the market using our gut instinct, or hyper-developed textual analysis machine, the brain? Because you can’t TEST that! What’s the point in trading an untested approach? That’s especially true for pattern based technical analysis (viz. heads-and-shoulders and co.) You wanna gamble, go to Vegas.
Principle #3: It’s no good finding ways to extract value out of all these assets if you don’t optimize the returns. Optimization here falls into two categories: combining them into a portfolio, to smooth out performance. As well as, finding the right leverage to boost your returns. It’s important to recall Druckenmiller’s words: “It takes courage to be a pig. It takes a courage to ride a profit with huge leverage.”
Having covered these fundamental guiding principles, we need to get a handle on how to exactly turn them into actionable trading systems.
We’ll start out with Principle #1.
Asset Biases
When it comes to assets, you gotta keep to things that you can invest in easily. In order of increasing difficulty (both in terms of understanding what’s going on and access) these are:
- Equities
- Bonds
- Commodities
- Currencies
- Everything else. And by that, I mean “alternatives” such as credit, hedge funds, real estate, volatility.
Though you can buy most of the alternatives in (5) via ETFs now-a-days, we’ll keep them out of the tool box for the time being, due to a lack of a long enough history.
Equities. What do you know about equities?
Well, they tend to go up. Don’t believe me, or are you getting pulled into the “wait for the dip” hysteria; here is a chart going back to 1871 (with and without dividends re-invested):
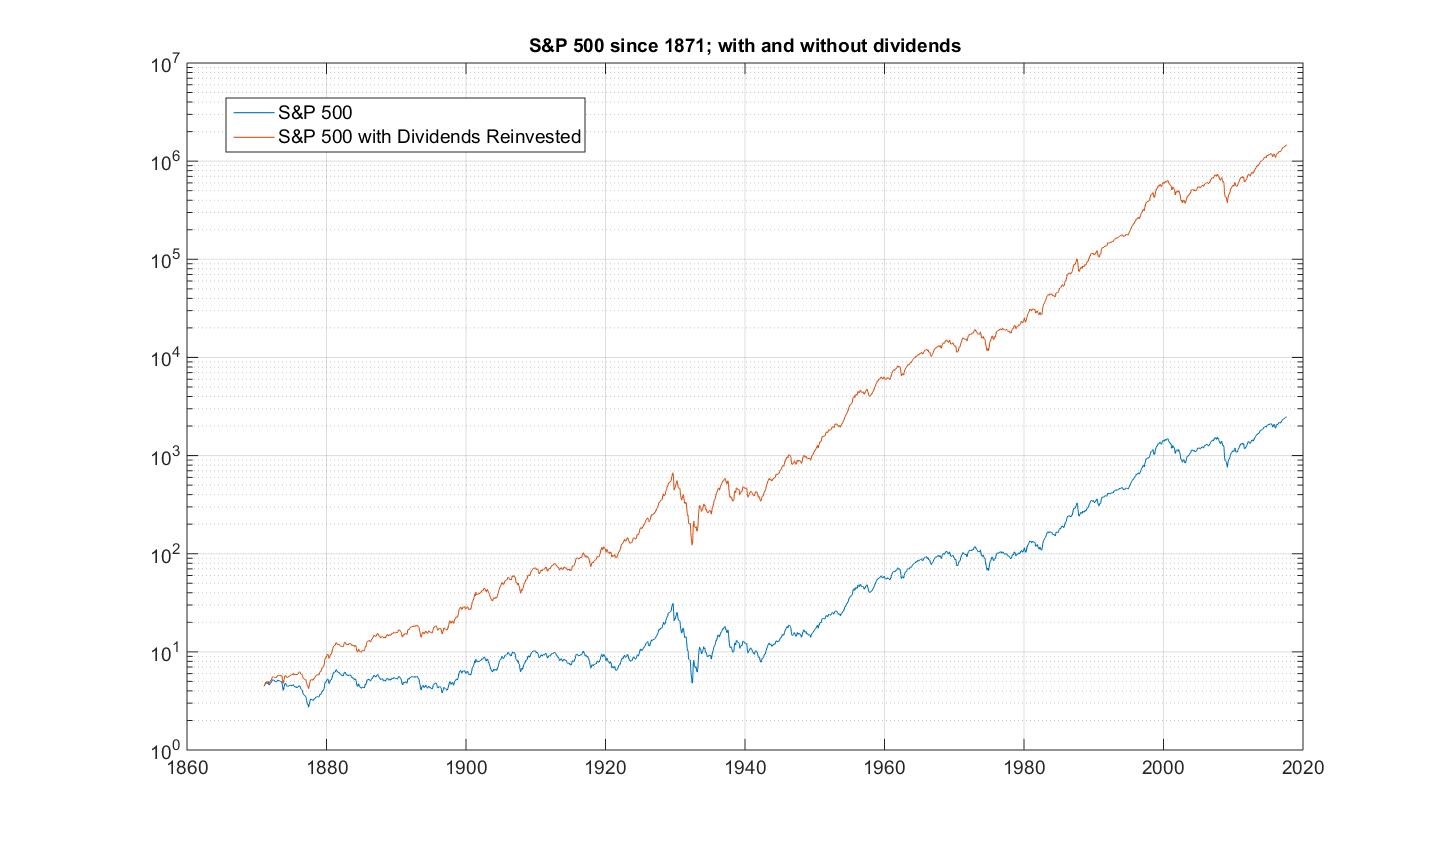
By the way the vertical scale is a log10 scale. Meaning these curves grow exponentially!
Even better. Take some time off and watch this video: RenTec Guy (Robert Frey) Gives Amazing Equity Speach
So that’s a bias: the “equities go up”-bias.
Any other biases we can think of?
Well for starters the biases that have been persistent across asset classes have been:
- Momentum
- Value
- Carry
Let’s define these.
Momentum
Things tend to go in the direction of their previous move. So if it went up, it’ll continue to go up. If it goes down, it’ll continue to go down.
How does that work for equities?
Well, one of the simplest momentum strategies has been: if it’s gone up for the last 12 months keep holding, otherwise go flat (or even short, if you have the guts for it).
Let’s see what that would have done for us on the S&P500 data above:
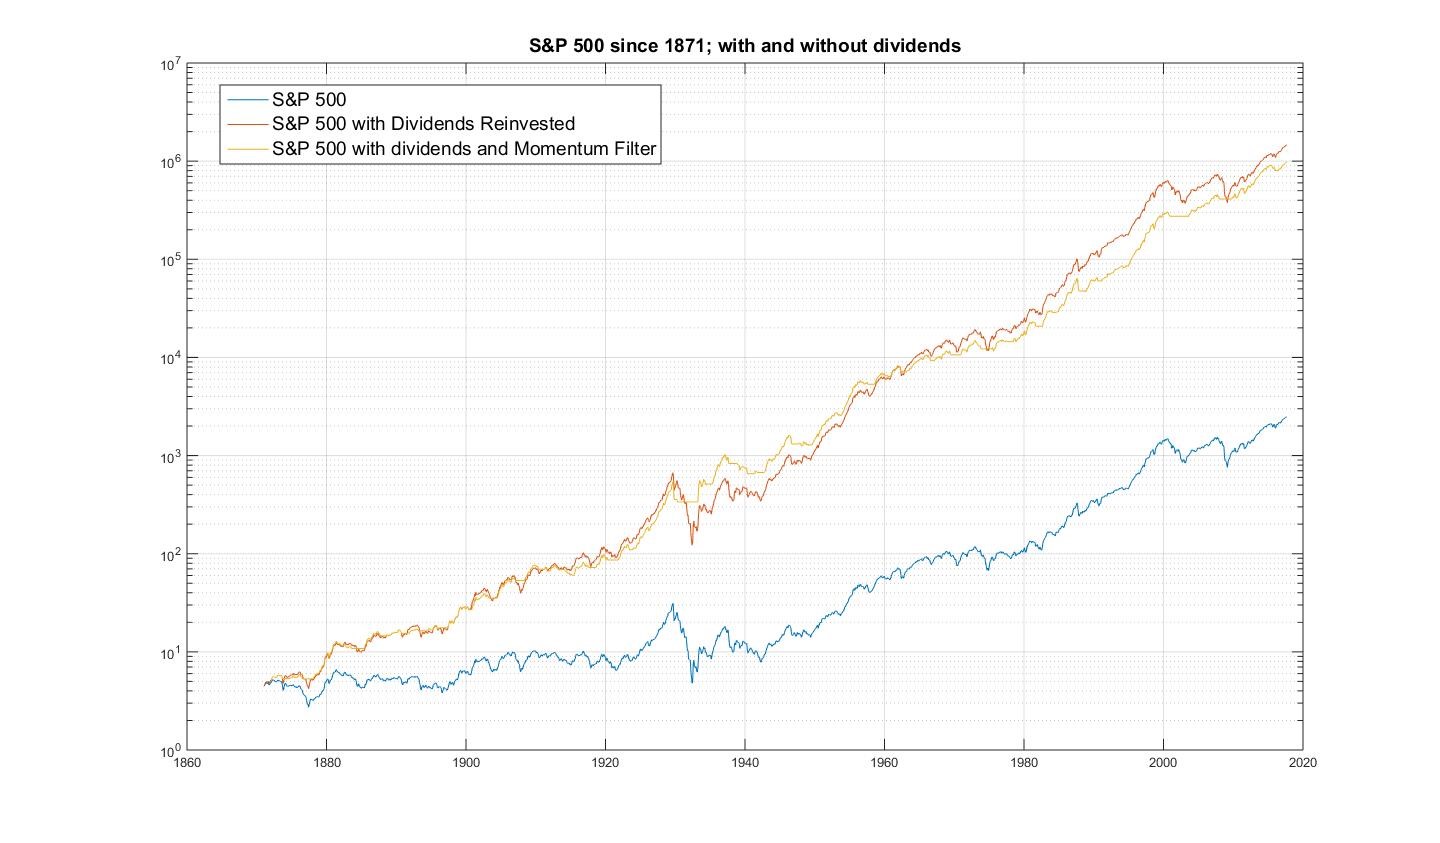
At first blush, the momentum filter doesn’t add much. But first looks are deceptive. Let’s compare these numbers in more detail. Note: all comparisons will be done on the dividend adjusted indices.
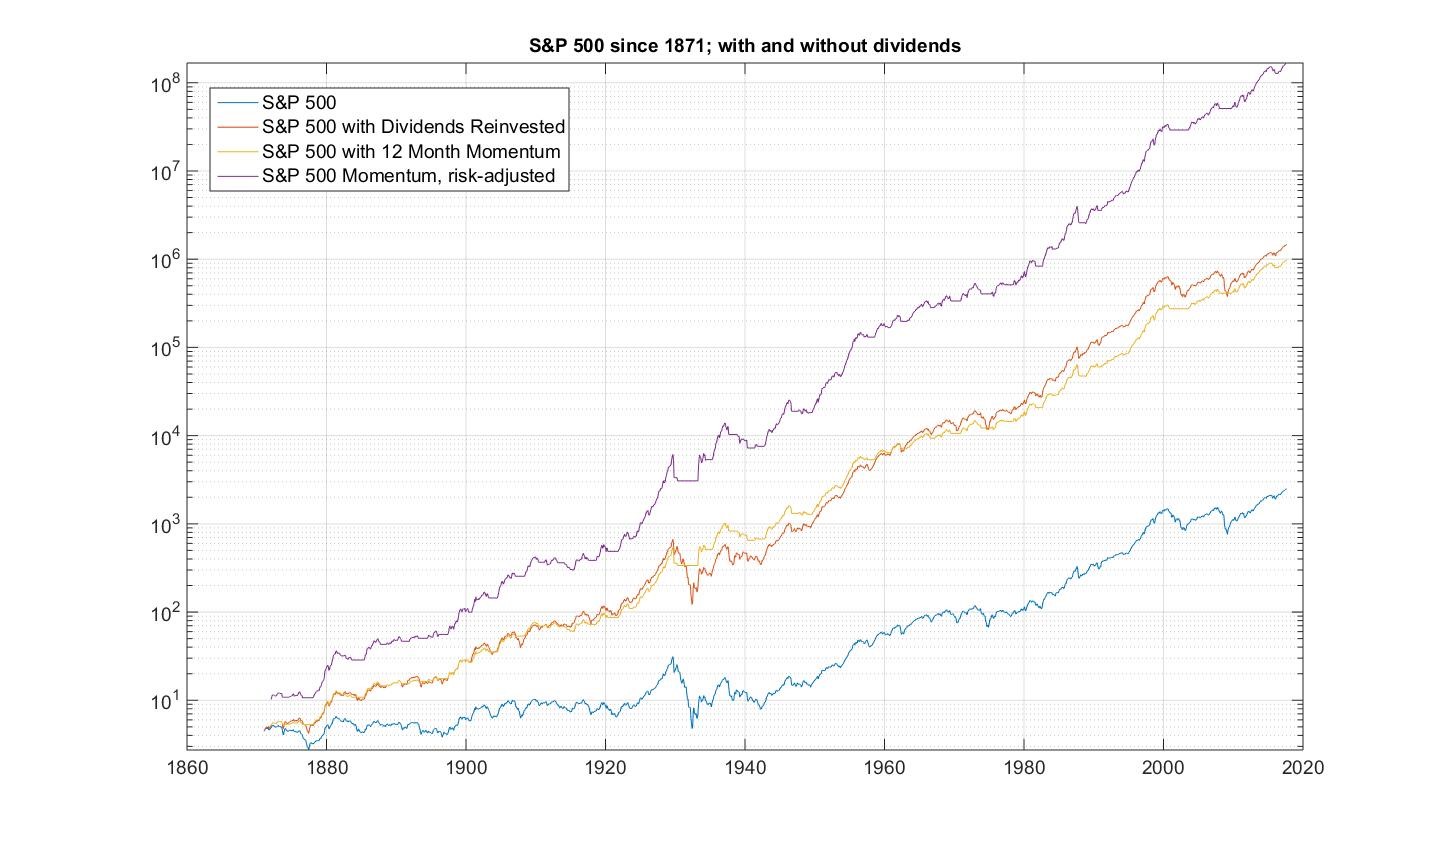
So, if you compare the riskiness of the S&P 500 index with the riskiness of the S&P 500 index filtered by 12-month momentum, you’ll see that the unfiltered returns are one and a half times as risky. Specifically, let’s work out the standard deviation of the two return-series:
S&P 500 with dividends = 14.0%
S&P 500 with dividends and momentum filter applied = 10.0%
So, if we’re going to compare apples with apples, we have to adjust the riskiness on of these two.
Given that people seem to always base-line their risk on standard equity investments, let’s risk up the filtered index (in real life we would do that by applying leverage, more on that later in this series).
The outcome is:
Now, admittedly, we are dealing here with re-constructed numbers and synthetic indices.
So, let’s move on to a real tradable. In the case of the S&P500 the easiest way to trade it is via the SPY ETF. This instrument is a tradable share on the NYSE. It’s been around since 1993 and you can grab the data at https://finance.yahoo.com/quote/spy/history?p=spy
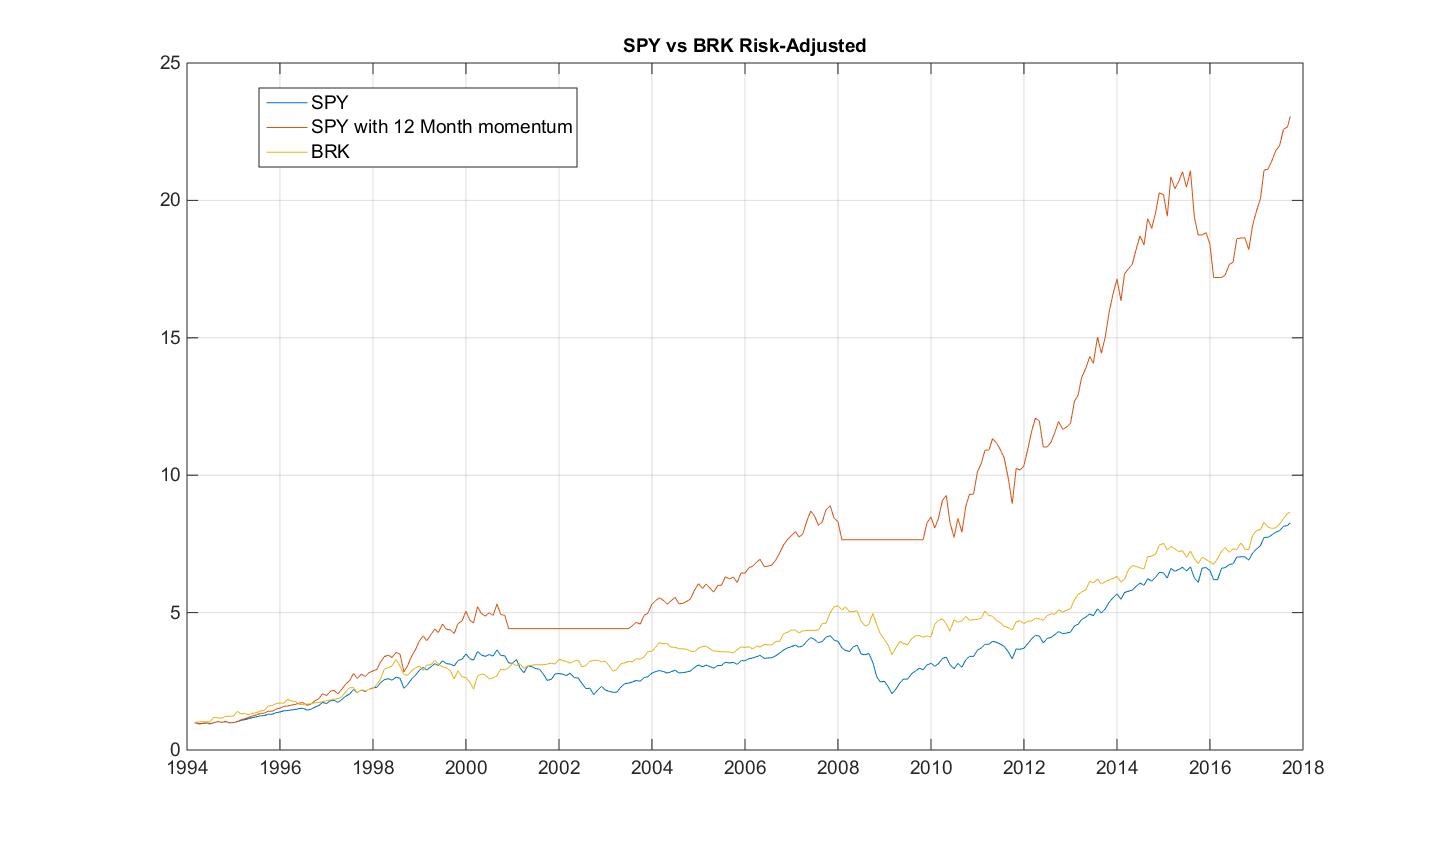
Applying the same strategy (and risk-adjusting the momentum filtered returns to correspond the SPY risk) we get:
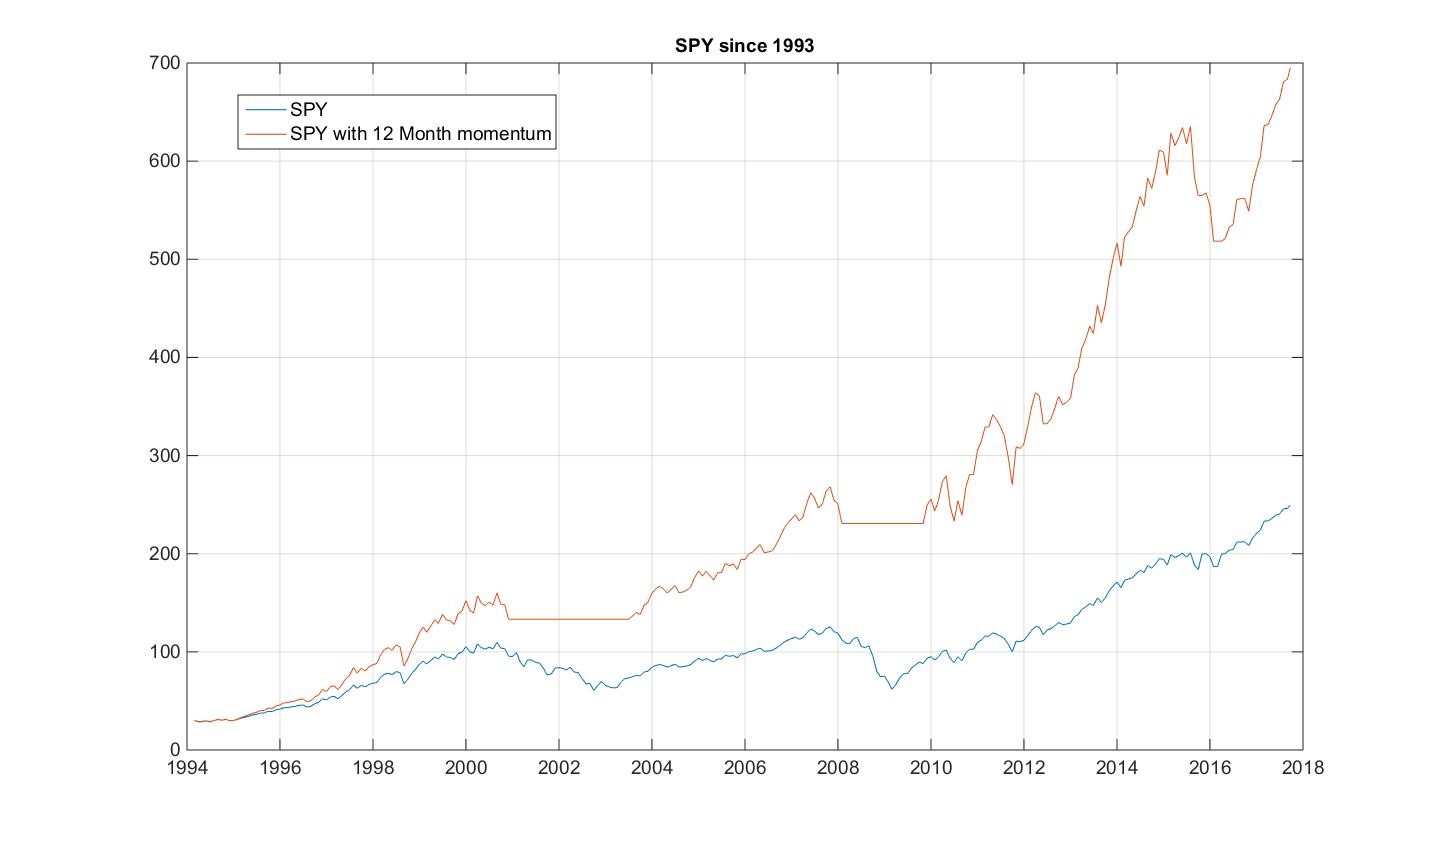
Not too bad!
So, we’ve improved on the buy-hold strategy using momentum. So, let’s go ahead and look at the other two.
Value
To perform a proper back test will be difficult. Primarily because it requires an extensive database of equities going back donkey’s years, together with all their financials, so that we can determine value.
In the spirit of keeping it simple, however, let’s just grab an ‘index’ that has been out there, reliably generating returns. Buffett’s Berkshire Hathaway. You can find the data here: https://finance.yahoo.com/quote/BRK-A/.
Note this is link is for the A series which currently stands at $200k. We’re using it as a data source as it has a long enough history. However, the B series, which stands now at $181 would be the much more affordable option, and shows the same performance. It’s history on the other hand is much shorter!
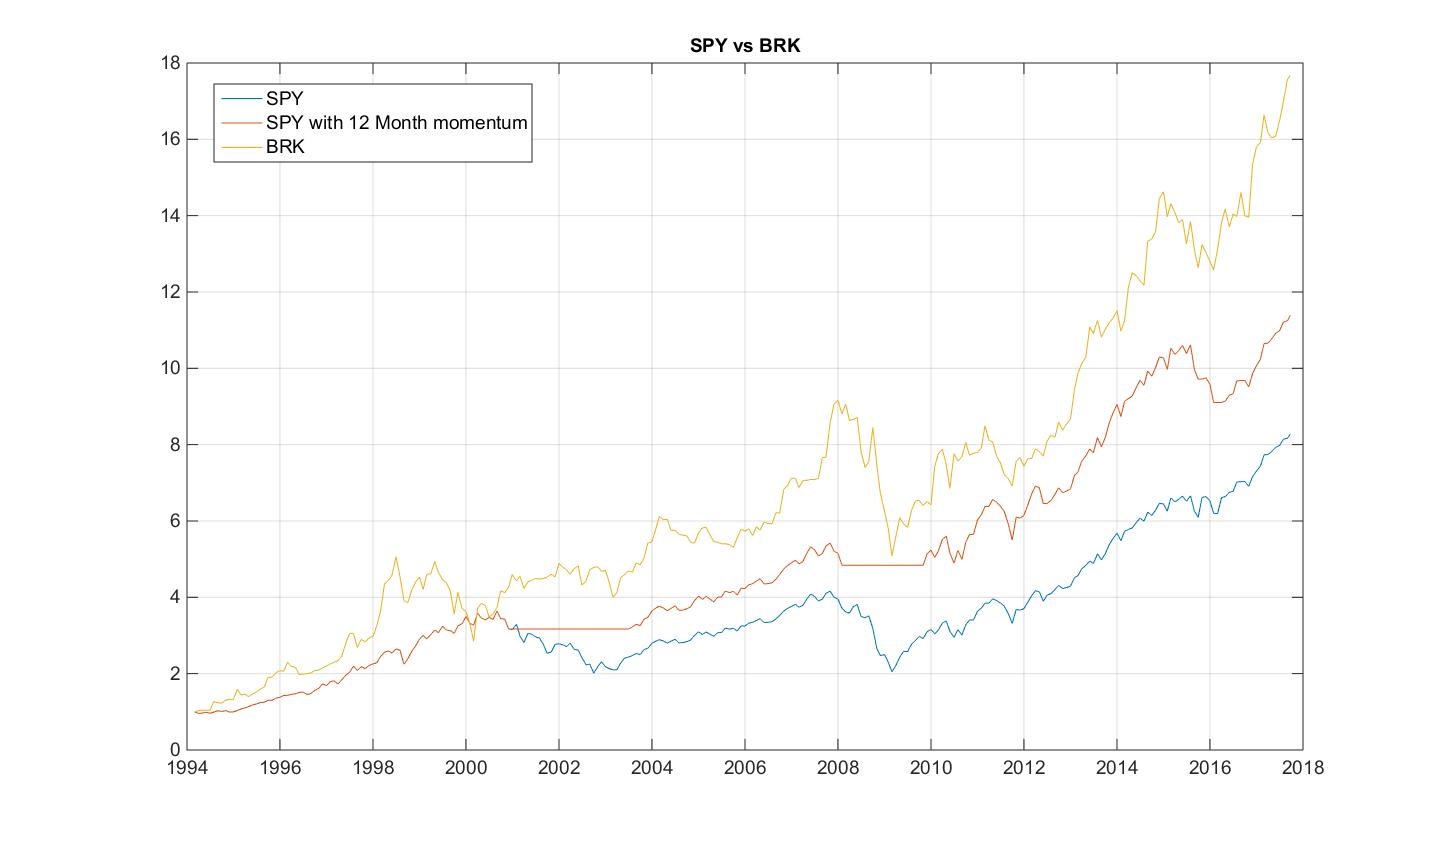
So, it certainly looks like value is the winner. However, let’s risk adjust all returns to equal to that of the SPY. The picture actually turns out to be slightly different:
If you’re still intent on implementing your own value strategy, it might be a good idea to check out these resources on how to construct your very own value portfolio: What Works on Wall Street, and The Little Book that Beats the Market.
Both books work on Benjamin Graham’s insight in later life that value can be easily derived from some very straightforward financial ratios (such as P/E, etc.). You then buy the ones with the most “value.” In the follow-up articles, we’ll see an even easier way of pursuing “value,” in a much more technical fashion.
Carry
Carry means earning an income. It’s something that is straightforward with Bonds to understand, since they’re built for income generation. But what about equities? Well, if you’re being old-fashioned, equities are supposed to generate income as well. That’s the point of being an owner in the business your holding the shares in. How? Via the dividends they pay.
Just to run some numbers past you: the S&P500 as a price index went up only 14,900% since 1871. Not too shabby you might say. Well taking into accounts the dividend income (and re-investing it), the actual return was: 135,200%. Nearly ten times as much.
The point about the Carry bias is to select those stocks which are paying especially high dividends.
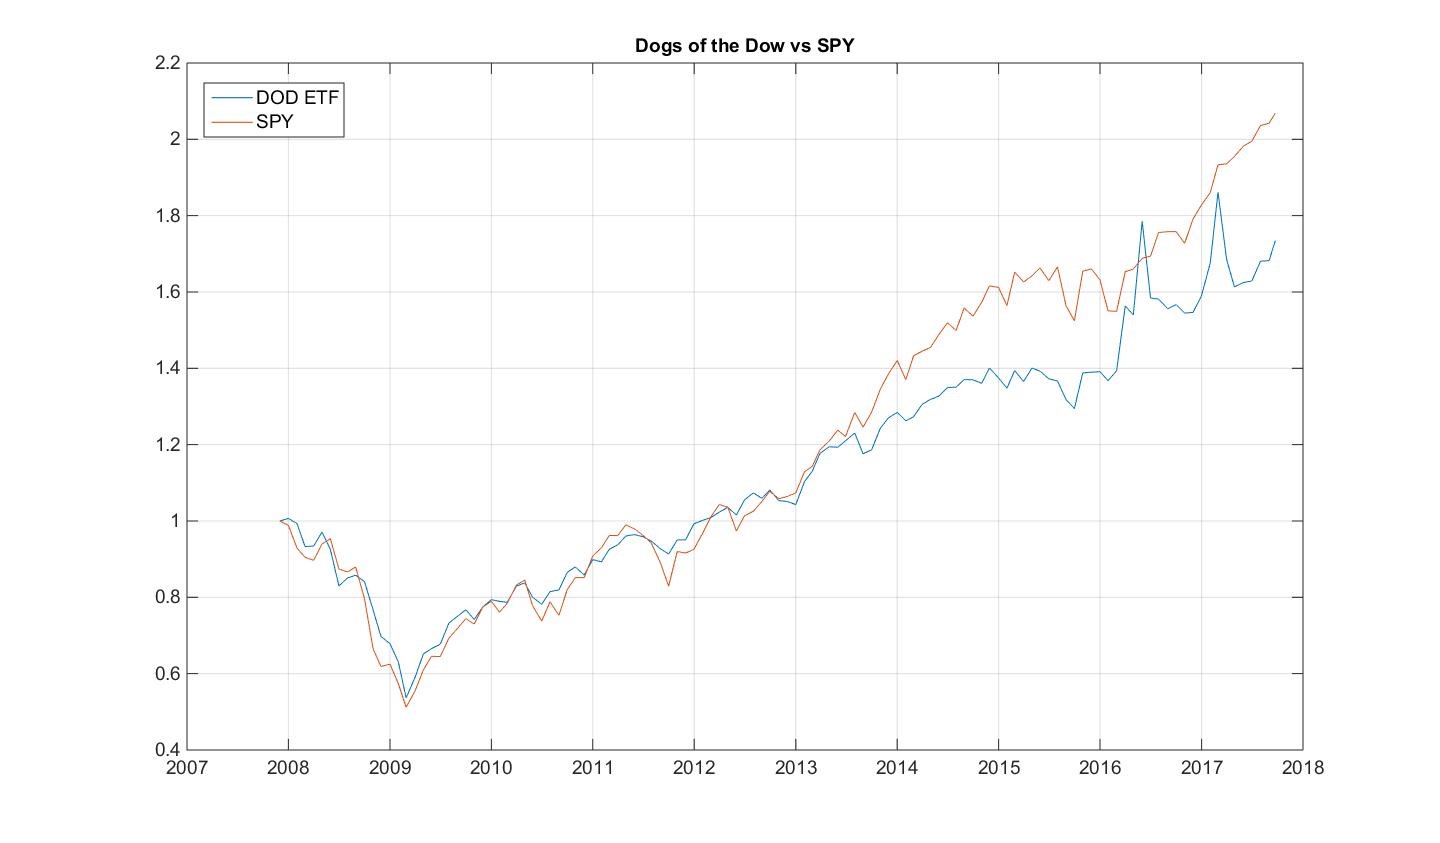
A version of this strategy out there is the Dogs of the Dow strategy, though it has a bit of value mixed in as well (high-dividend yield means low price, and hence can imply an under-priced stock). In essence, the DoD says to simply buy and hold those stocks with the highest paying dividends. There’s even an ETF out there that since 2007 emulates this strategy. Its performance compared to the SPY is:
Spoiler alert: given how easy buy-and-hold and momentum strategies are compared to the other two strategies, we’ll take the easy way and simply include these two in our portfolio construction later in the article series.
Recap
This has been a long tour for the first part of this articles series: Putting Together a Trading System from Scratch. It’s good to take a break here and recap.
We’ve covered:
- The three principles you need to follow to be successful:
- Assets have biases, so find them
- Figure out rules to extract value
- Construct a portfolio that extracts value in an optimal way.
- Asset biases: we started out with equites and discovered that two of the simplest, and on a risk-adjusted measure most profitable approaches over the last 150 years was / is and most likely will continue to be momentum and buy-and-hold.
As you can see we still have some ground to cover (bonds, commodities, currencies and the lot).
See You Next Time…
Next time round, we’ll be continuing with a technical variant of mean-reversion for equities which has proven profitable over the last 25 years, and which doesn’t let up.
I’ll also give you a taster on what portfolio construction entails, and how to go about extracting as much value as you can out of your very own simple momentum / mean-reversion equity portfolio.
So, until next time,
Happy Trading.
If you have enjoyed this post follow me on Twitter and sign-up to my Newsletter for weekly updates on trading strategies and other market insights below!

Im glad I came across your article, the part where every asset has its unique bias is an eye opener and something I been noticing lately even in the supposedly correlated assets….looking fwd for the conclusion of this topic and also if you have any suggestions as to a combination discretionary and mechanical system?? Also, the bookd, “Trading System Methods, Wiley Edition”, is this something a beginner can pick up from or do you suggest some other title?
Hi Aurelio,
Thank you for leaving a comment!
Regarding combining mechanical and discretionary systems: ultimately everything can be measured. You should take the trade log of your discretionary trades, and measure exactly the kind of risk you tend to take, as well as the profitability. This will ultimately allow you to trade your discretionary style just like any other trading approach and gauge how to best incorporate it with a mechanical system. Even if the expectancy of your discretionary approach is negative, it might just be that it acts as a good hedge on average to your mechanical approach, and you might just realize that it is worthwhile keeping at it.
However, you can only really judge that by having kept a meticulous log.
Regarding Perry Kaufman’s book, I’ve got this collection from his third edition onwards. It is a good collection of ideas, which you ultimately can implement and test. I like that it is so comprehensive, covers so many approaches and has the trading literature so well covered. It’s a great compendium of summaries of most stuff out there. Definitely worth having.
What I have found with it, however, is that it won’t necessarily provide you with a ready made solution. That’s still up to you.
Hi Corvin,
Thank you for all the information and resources you have been sharing. Your approach has definitely opened up a whole new perspective to trading.
How can I access the subsequent parts to this article?
Hi Imran!
Thank you very much!