This is the second article in the series of trading the Bullish and Bearish Engulfing candle stick patterns. Following on from Part I, we will actually perform some backtests using the results we found in Part I.
In Part I, we split up the analysis for long and short trades separately. Here we will keep to this approach. The justification is that there need be no symmetry between the long & short approach. This is especially true for equity systems, where bear markets have distinct dynamics from equity bull markets. You could argue that for G10 currency pairs the returns are more symmetric (as evidenced for instance in the fact that volatilities exhibit more of a smile rather than a skew for G10 currency pairs). However, you should always keep an open mind!
So let’s recap the results for:
- We used hourly rolling bars to identify the appropriate four-hourly patterns
- Trading in the direction of the breakout was profitable
- There was a sweet-spot for holding the trade for roughly 12 hours
- I suggested a stop-loss of 100 pips
So let’s see what happens if we apply these trading rules:
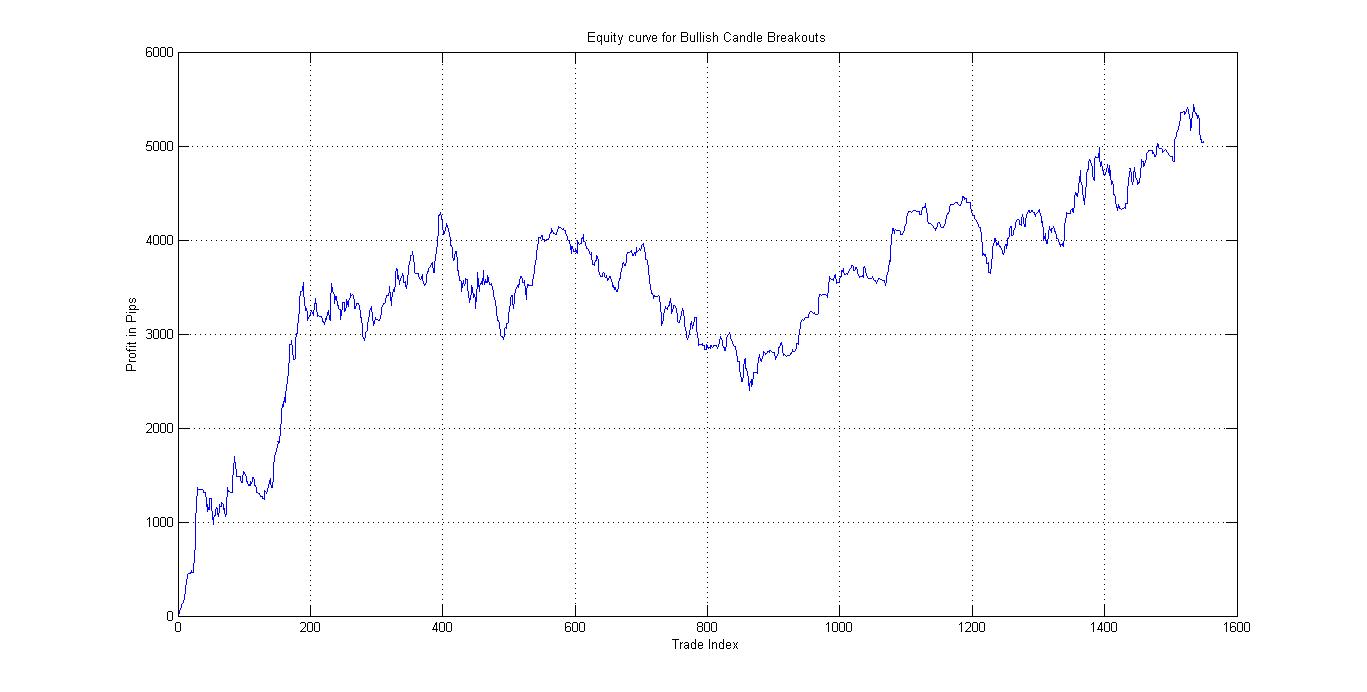
The data used to backtest this system on ranges from 1st Jan, 2010, to end of 2015. The outcome: great performance for the first 400 trades, and then it goes sideways. This happens as of Aug 2011. It started producing returns again as of end of 2013.
Why? (One of the most important parts of building a system is to understand which market forces affect the system. This allows one to construct something that is flexible and adaptable, and gives you the understanding to know when it will stop working!)
The first guess is that it might have something to do with volatility; that is the size of daily swings in the EURUSD market. This guess is driven by the fact that we are trading a breakout system, and so it needs movement in the market to make money.
Plotting out EURUSD against its 21-Day ATR (Average True Range, which is a measure of average daily EURUSD moves in pips) gives:
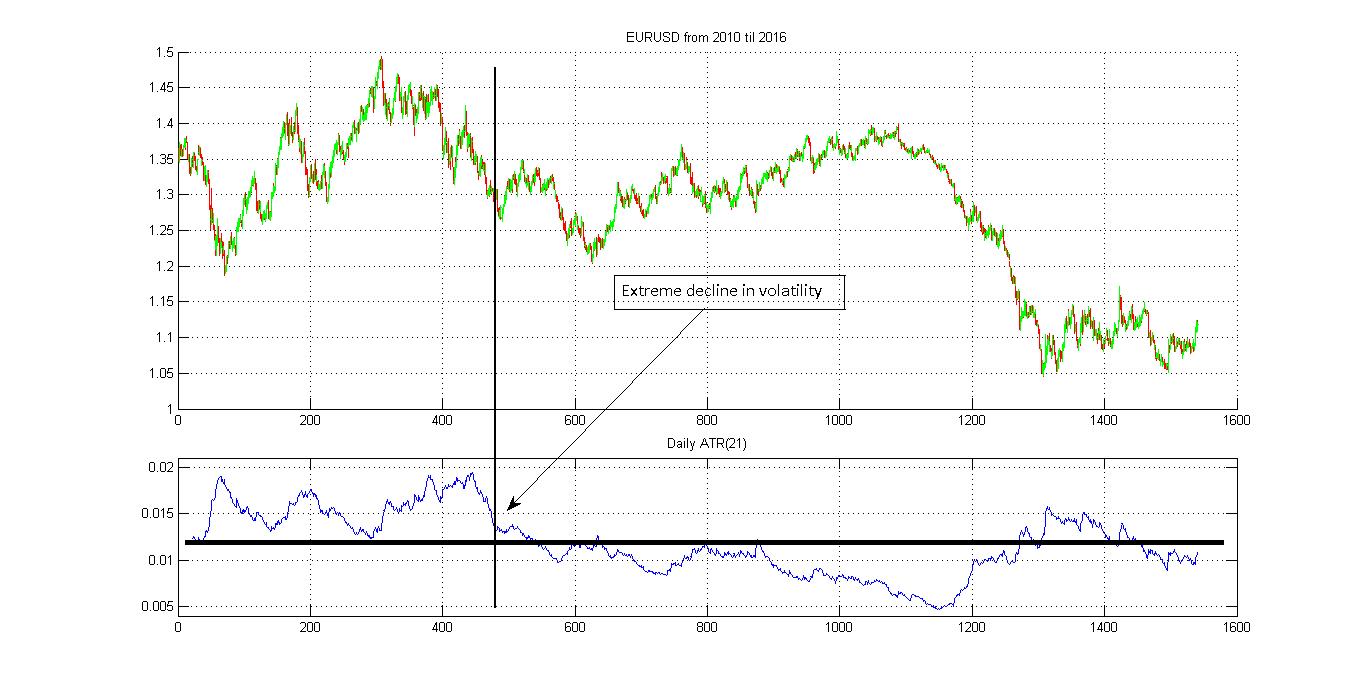
As we see the decrease in volatility corresponds to under-performance of the system.
So the next step is to ask, how we can improve it. The first suggestion is to make the stop-loss adaptive rather than fixed at 100 pips.
But if we’re introducing an adaptive stop, it might make sense to think about take-profits as well. We will keep the running of the setup to 12 hours. That means that from the time of putting the breakout order on, until we either cancel the order (because it wasn’t triggered), or close it out because neither the SL nor TP was hit, is 12 hours.
For the purposes of illustration we will set the stop at twice the height of the engulfing candle, and the take profit at half the height (I know, I know, let your profits run, but I’m greedy).
So what does the new set up do?
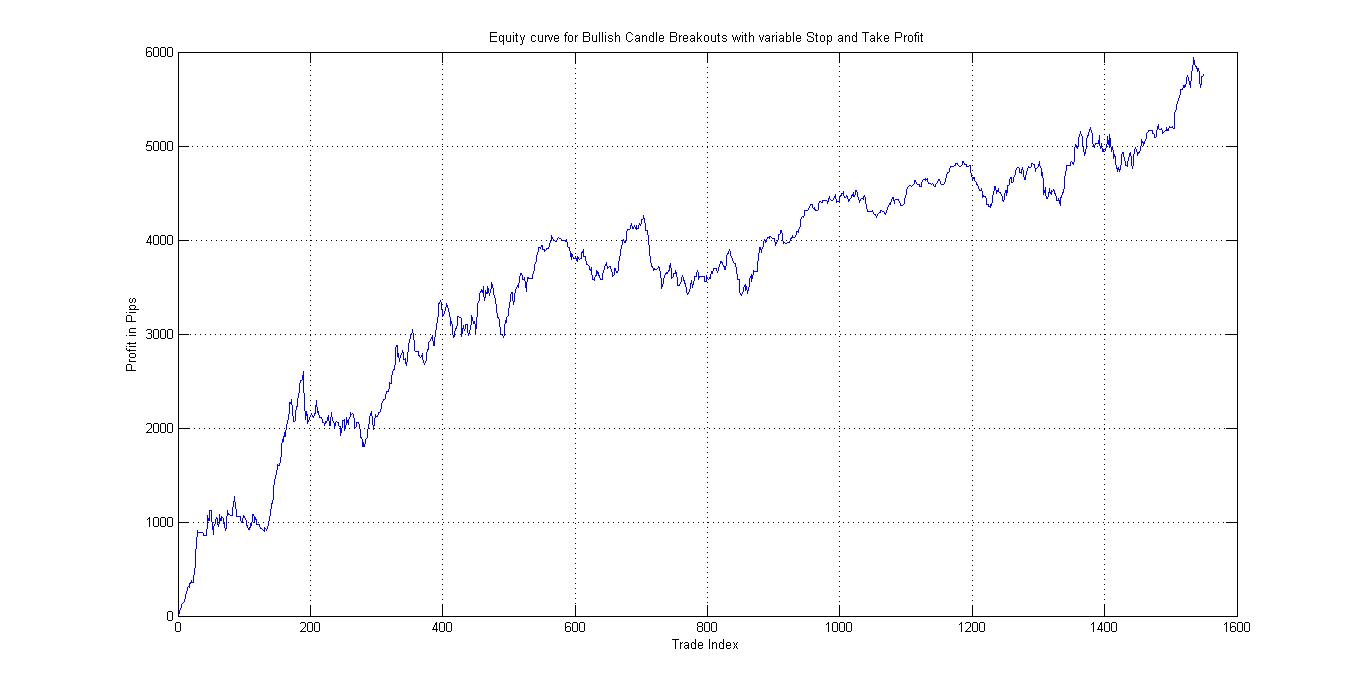
As I pointed out in a recent presentation at the London Forex Show, fiddling with the original signal via stops or take-profits, rarely will significantly increase profits.
And yet, if you have been following this far, the first thing that should hop out at you: the overall structure of the P&L curve is different. It’s “smoother”, in the sense of lower drawdowns, with smaller swings on a daily basis. In essence we have introduced control on the downside.
What this does is to allow for greater leverage to be applied than the previous system, and hence more money to be made! As Soros and Druckenmiller said: “It takes courage to be a pig. It takes courage to ride a profit with huge leverage.”
One good check to see if an approach like this is stable is to look at other currency pairs. One would hope that the property we are exploiting to make money is “universal” to currencies or intraday order-flow, rather than an idiosyncrasy of EURUSD or even a fluke in the EURUSD data, though failure on any other currency pair is not necessarily an indictment of this pattern system.
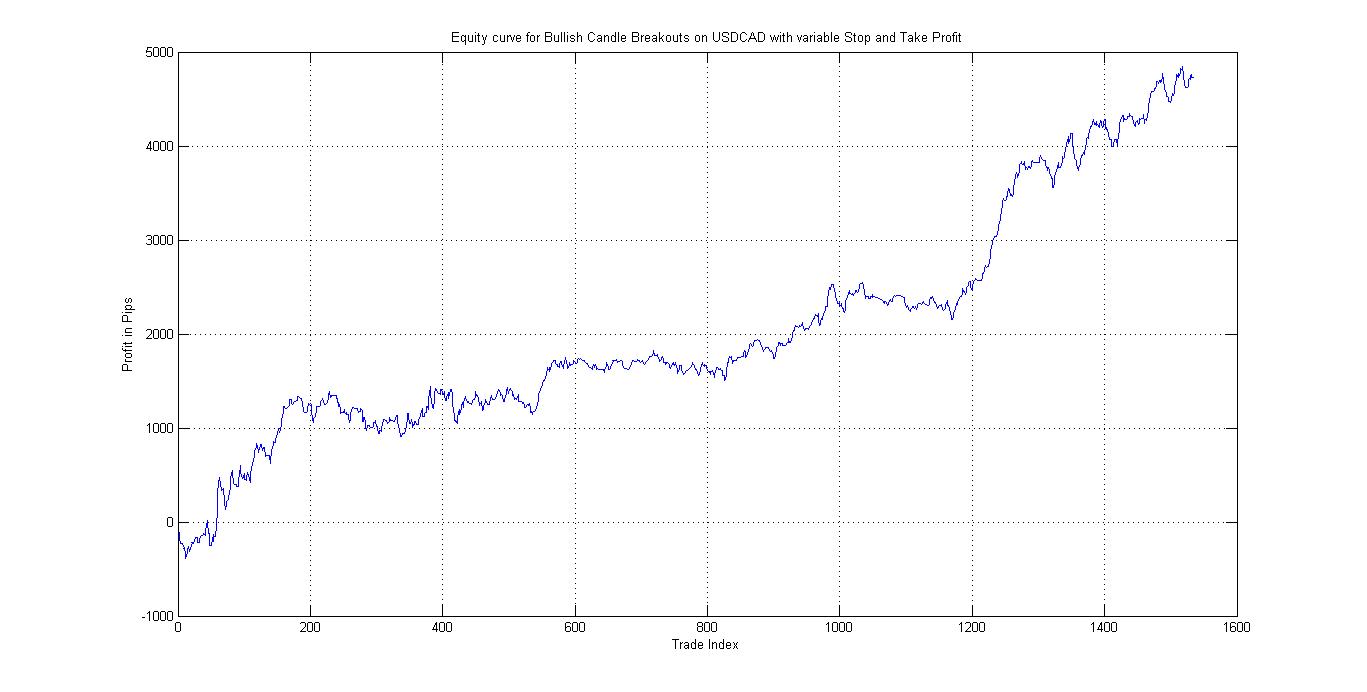
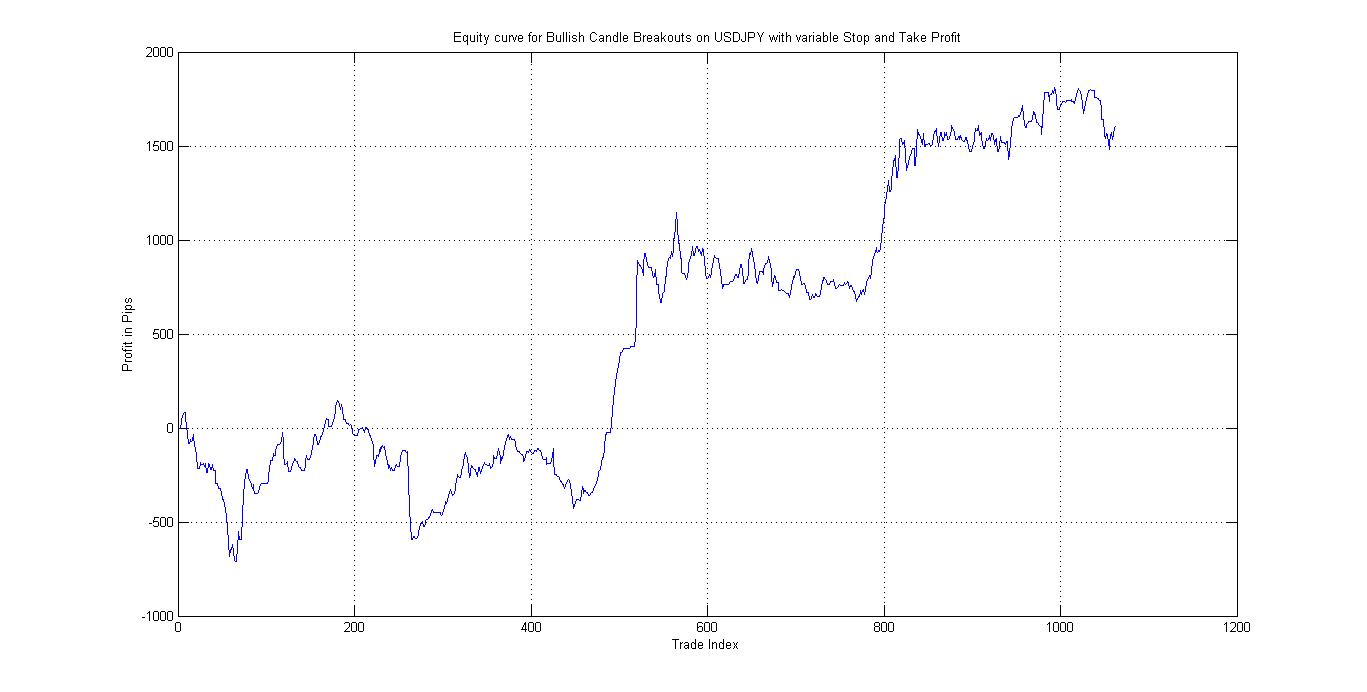
So let’s test out the identical approach on USDCAD, AUDUSD, USDJPY and GBPUSD. These tend to be the currencies which are useful for intraday trading.
USDCAD
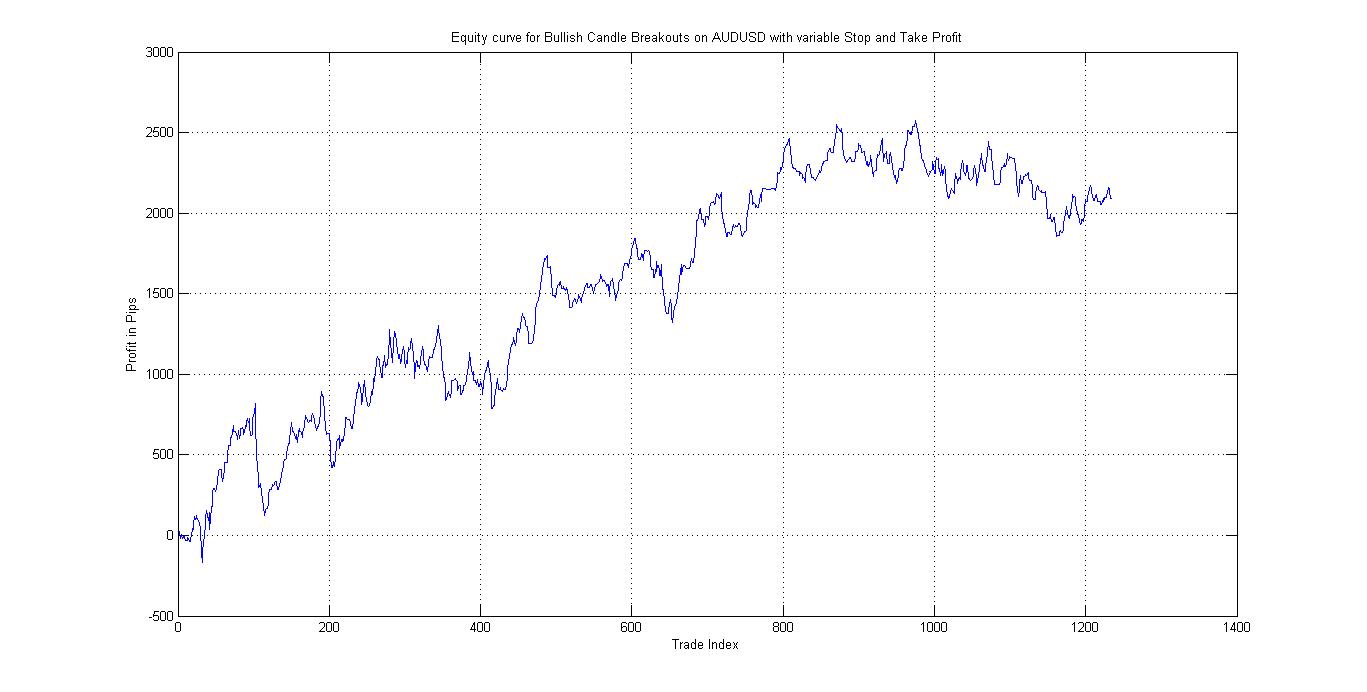
AUDUSD
USDJPY
GBPUSD
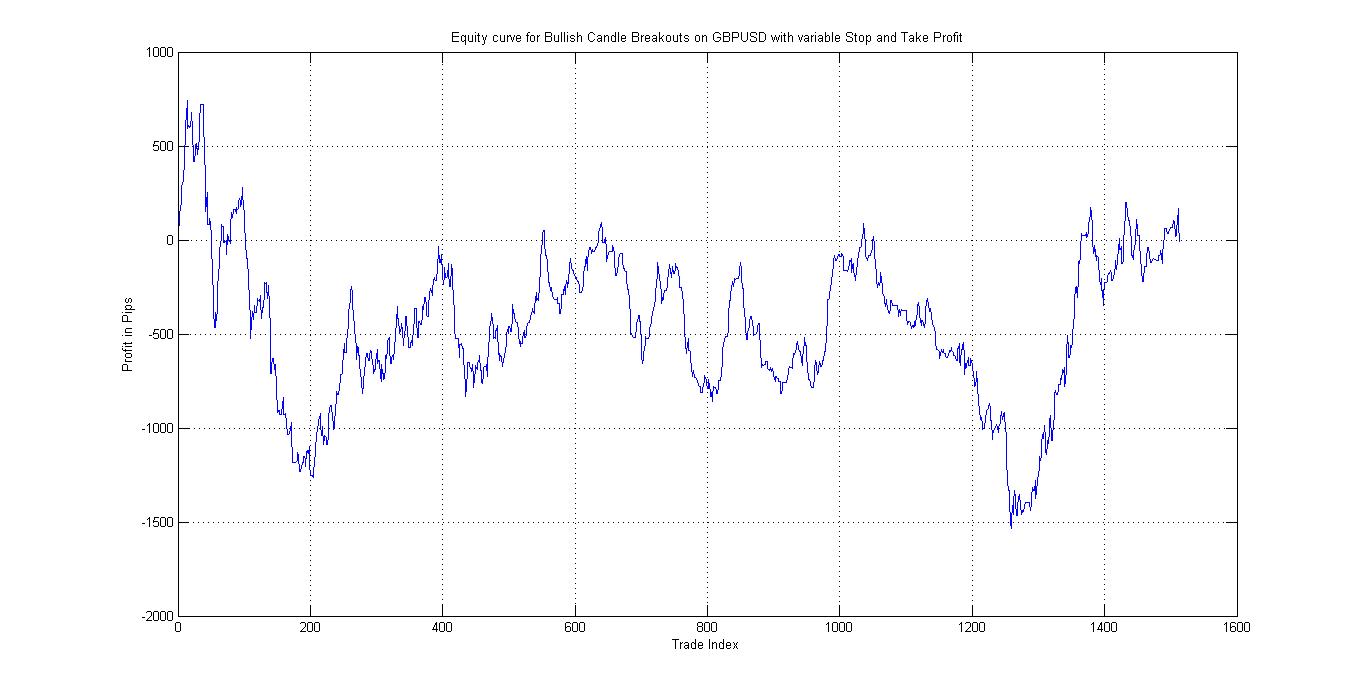
So for four out of five currency pairs it works. Not too bad. We can also see from the P&L curves that the performance is diversified enough that when one pair goes through a rough patch, the other performs.
And for GBPUSD at least it’s only flat, and not a straight line down.
But remember, we have only considered the short side up to now!
Just to recap the trading rules for this setup:
- Identify a Bullish Engulfing candlestick as on a rolling hourly basis, as we did in Part I.
- Set a stop order to buy above the recent high.
- Let the order / trade run for 12 hours.
- Set a stop-loss for the trade at twice the height
- Set a take-profit at half the height.
In the next post we’ll take a look at the short side. We’ll follow up with looking at combining long and short systems across currency pairs. Afterwards we’ll look at a Linda Rashke’s Turtle Soup alternative, in which we fade the breakout signals, and see what happens then.
So stay tuned.
If you’ve enjoyed this article sign up to my newsletter and follow me on Twitter!

Leave a Reply