This week’s article is more tongue in cheek: do natural phenomena affect the markets? What we’ll be particularly looking at are the full moon, new moon, and solar eclipses, especially since we had one on the 9th March this year.
Back in 2005 I wrote a similar article at Barclays Capital for the weekly quant newsletter we sent out to clients. It was a summer lull, and it seemed like a swell idea. The results back then indicated that it was the New Moon rather than the Full Moon that really impacted markets. This ran counter to the usual old-wives tale that “bad” stuff happens when the dogs start howling at the Full Moon.
So it was time to update the calculations and see what they brought.
This time, however, there is a slight twist, or let’s say an “astronomical” realization. You can only have a Solar Eclipse when you have a New Moon. So I sifted through the data to separate out these two events from each other.
With the calendar data in hand, I ran the numbers past the G7 majors: EURUSD, GBPUSD, AUDUSD, NZDUSD, USDJPY, USDCHF, and USDCAD. And to my surprise some interesting results came out.
The currency data spans the time period January 1971 to December 2015. We listed the moon phases and the eclipse dates, and tested the returns on those dates.
Let me summarize the results, and then I’ll take you down the analytical path showing you how to come up with these results.
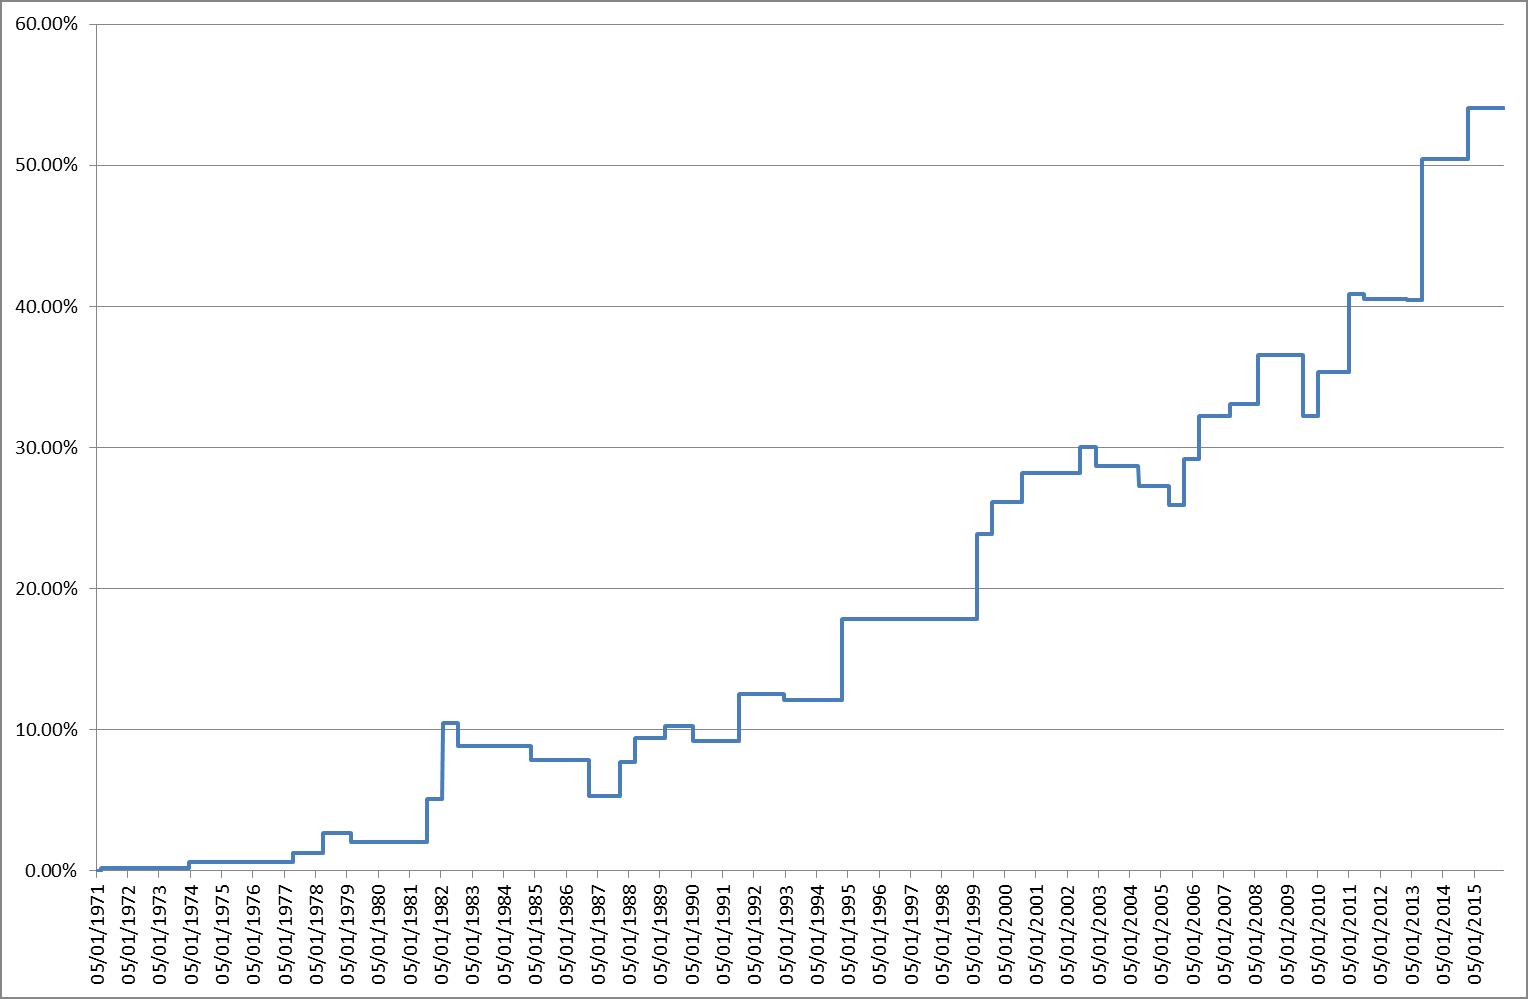
Uniformly across all currency pairs during an eclipse the US Dollar strengthened. By buying the US Dollar during that time the realized Sharpe Ratio would have been 0.5, and the Sortino Ratio 1.34, which are very respectable numbers over a 45 year time horizon. The annualized return over that period is only at 1.2% (for a total return of 55%); however, the annualized volatility is very low as well, only at 2.8%. If you were to normalize to the typical 16% volatility you see in the equity markets, this would give a 7% annualized return. Measuring only the volatility of downside returns and adjusting that to equity risk would have yielded an annual return of 20%. Now these aren’t bad numbers!
The most significant effect was observed in USDJPY and USDCHF (both save haven currencies!).
Here is how the P&L chart looks like:
So how significant are these results? That is, how seriously can we take them? We had only 36 eclipses in that time (which fell on trade days), which gives across the 7 currencies 249 observations (the EURUSD time series goes only back to 1975). Is that enough? You tend to hear that you need lots and lots of observations to get comfort around a phenomenon.
Well in this case we have something else that really works in our favour: the time over which we tested. A total of 45 years. The fact that the annualized Sharpe Ratio is at 0.42, means that in every year for every dollar we risk we expect to get 50 cents back. However, this translates to $2.80 return for every dollar risked over these 45 years we tested. That is a very good indication that the strategy is very stable.
Interestingly, if we test for Full Moon or New Moon effects, we draw a nil.
So in essence the New Moon results that seemed vaguely significant in 2005, actually were hiding the remarkable Solar Eclipse returns we see here.
<WARNING, Slightly Technical Bit following>
So how can we statistically test for this effect?
Simple. For each currency we use three dummy variables which indicate a Full Moon, a New Moon, and a Solar Eclipse. We then regress the daily returns against these dummy variables, including a constant, which indicates the base –line case of expected returns on any other day. As expected this constant is almost zero across all seven currency pairs, which shouldn’t come as a surprise, given the range boundedness of these currency pairs. On the other hand the coefficients in the regression for the Eclipse dummy variable are significant. Another check is the F-statistic for the regressions, which is highly significant for USDJPY and for USDCHF.
Now this is interesting, because both JPY and CHF are seen as safe-haven currencies. Could it be that Solar Eclipses induce euphoria, and people rush out of Safe Haven during that period?
I did not test for Lunar eclipses here, as they occur during Full Moon periods, and those were indeed completely insignificant in terms of effects on currencies, though digging in the data might reveal otherwise.
In any case, the next Solar Eclipse is 1st September 2016, so keep your eyes peeled on the US Dollar then!
If you want to test out the data for yourself, I’ve included the spreadsheet with all the information here.
If you enjoyed this article follow me on Twitter and sign-up to my newsletter below!
Get Your Action Guide Here:


I never knew that astronomical changes can effect our currency trading.
Thanks Corvin
Hi Kamil,
The relation might be tenuous, the saving grace here is that I tested for the effect the first time 11 years ago, and 11 years later it is still going strong without modification. Does this imply any direct causation? Not necessarily, as the transmission might complex, or even non-existent.
It boils down to how you approach deriving trading signals: pure pattern recognition or intuitive and heuristic reasoning. People do both. Here is a quote from “More Money than God” from Robert Mercer at Renaissance Technologies: “If somebody came with a theory about how the phases of Venus influence markets, we would want a lot of evidence. [But,] some signals that make no intuitive sense do indeed work. The signals that we have been trading without interruption for fifteen years make no sense. Otherwise someone else would have found them.”