
A favorite investment technique that has been publicized widely is trend-following. Everybody has heard of the Turtle Traders, a group of novices trained by Richard Dennis in the art of channel-breakouts, a system developed decades earlier by Richard Donchian.
In this article we will look at the current performance of trend-following in the Western futures markets, and see if we can’t find better performance in other markets. As previous mentor of mine always said: it’s not so much about the strategy as the pond you choose to fish in that will determine profitability!
Of course breakouts are not the only way of trading trends. Other favorites are moving averages, Kalman filters, the list goes on.
The key determining features with the majority of these systems tends to be:
- Strong risk control
- A diversification of assets traded, usually at least 30, though most trend-followers trade up to 100 futures markets globally
- Entry and exit rules based upon trend detection
These systems have performed incredibly well. Trading a slight variant of the Turtle Trading system since 1974 would have provided following return stream:
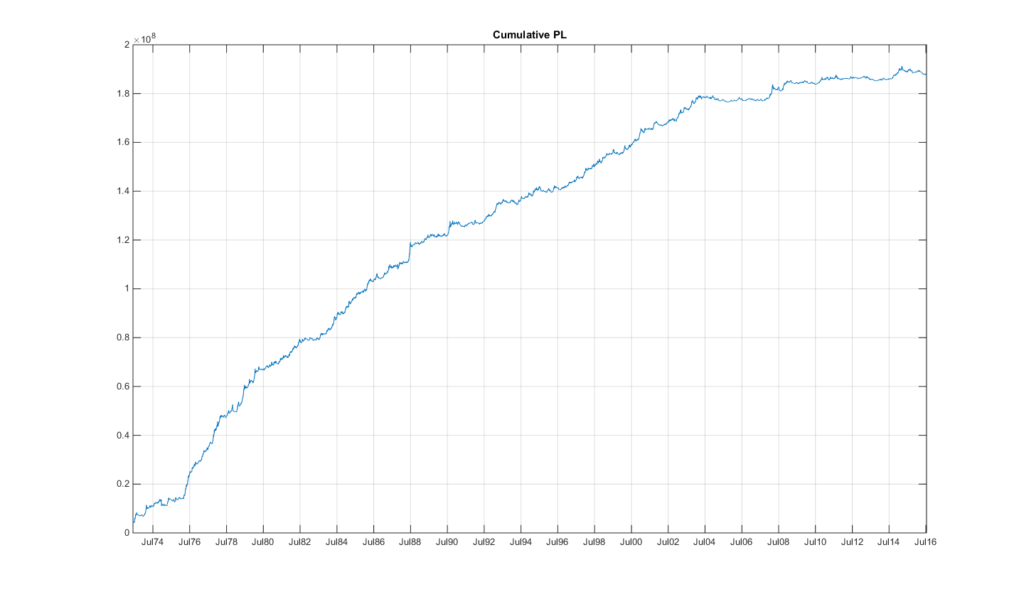
This kind of performance of course attracts a lot of attention and of course a lot of capital. Winton Capital, a world-renowned trend follower, originating from the AHL franchise, manages over $30 billion in assets at present. Aspect Capital, another AHL offspring, manages $7.4 billion at present.
These ain’t numbers to be sniffed at.
However, a general malady has taken over the CTA industry (another name for futures trend-followers). As you can see from the chart, the performance has drastically declined since the mid-2000s, though it was on the decline already since the mid-90s.
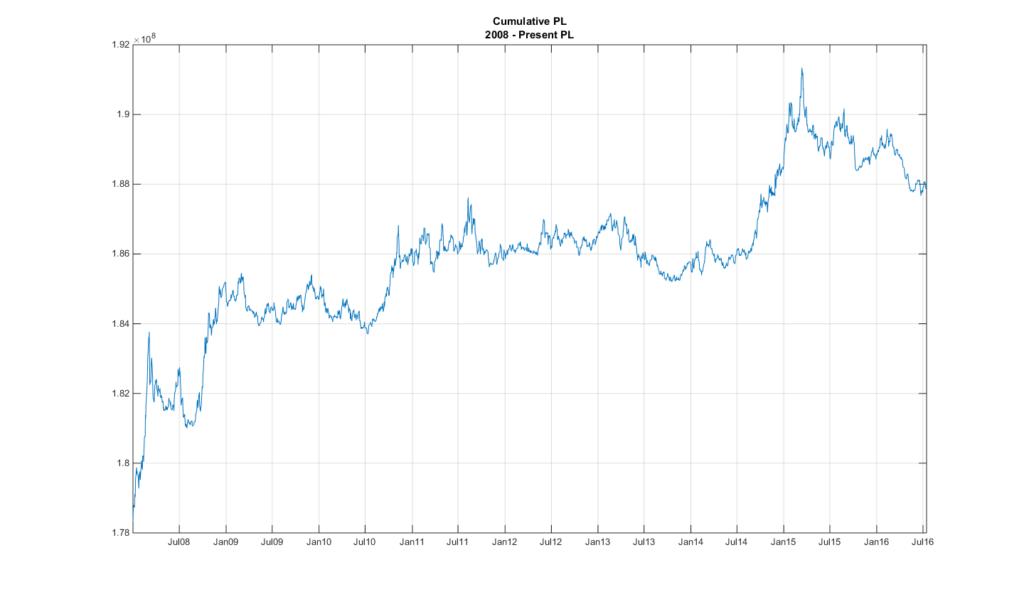
It feels as though the juice is running out.
How can that be the case?
There are several explanations available. The most obvious is the low interest rate environment that has persisted for the last decade.
A lot of futures funds run on low margin requirements (since they trade futures), and hence historically they invested the remaining cash in high interest rate deposit accounts. This was a massive to returns.
A second effect has been flat yield curves. This means that the difference between long end and short end interest rates became very low, and the natural appreciation of long dated bond instruments as they approach maturity disappears.
Here is what trend following on bonds has looked like in the last 40 years:
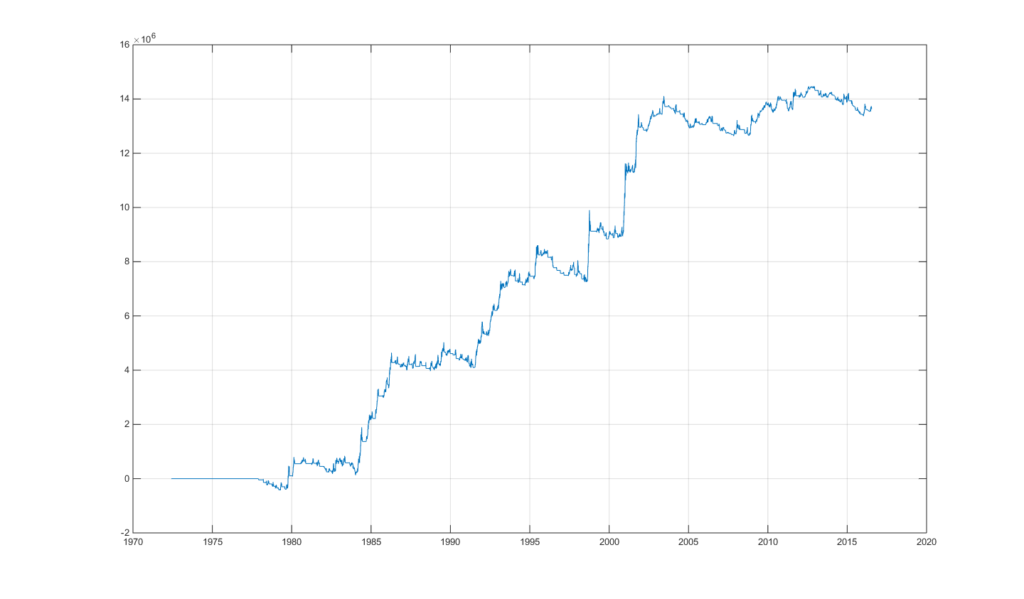
It’s flat-lined.
And given that fixed income makes up for a large allocation it explains in part the reduction in performance.
But enough of moaning about decline of trend-following in the western market; let’s find a better pond to fish in!
One futures market that has been exploding in recent years is the Chinese commodities market. One of the biggest barriers to entry has been regulatory restrictions of outsiders trading these markets. (You still can if you partner up with a Chinese counterparty, and most recently Beijing is giving strong indications to open up the markets fully to international participation).
One effect of these barriers has been the restriction of market participants to local traders, who at present are showing the same kind of speculative frenzy that seemed to exist in the commodities markets back in the 70s and 80s in the western futures markets.
Specifically this means that whereas in western markets trend-following over the decades has shifted more and more to longer-term signals, the Chinese futures markets still predominantly lives of short lived momentum. This shift to longer-term momentum was one of the obstacles that made the original Turtle System grind to a halt.
Well let’s apply short dated trend following to the Chinese futures markets. The results are truly astounding:
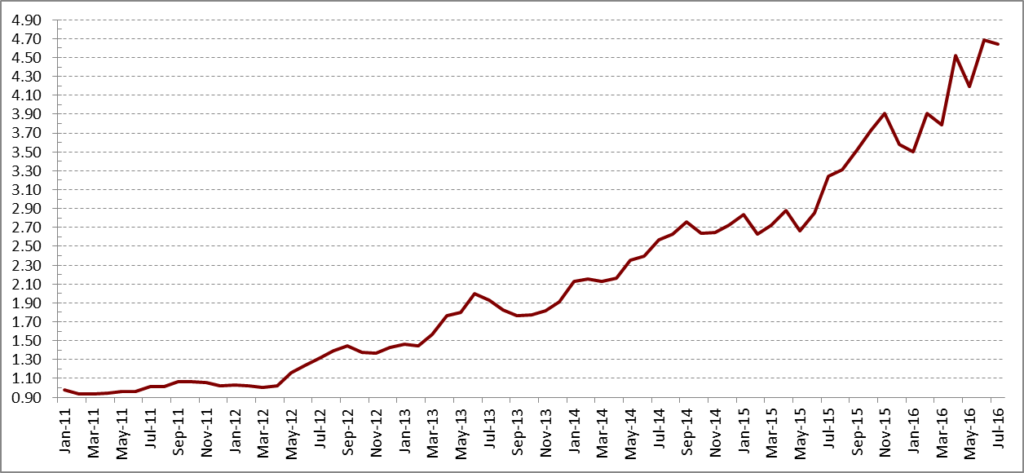
This involves trading the 33 most liquid futures markets in China (from Glass to Sugar or Egg futures, as well as Nickel, Tin, Nickel, or Polyethylene!)
The results are truly astounding: annualized returns of 30% since 2011, with a maximum drawdown of only 11%.
How soon til the party finishes? That’s hard to say, but the majority of market participants at present are far outweighed by speculators rather than long term investors, so as long foreigners are kept at bay, or don’t find methods of developing a big investor footprint in China, the argument could definitely be made that the trend for this kind of performance will continue for several years to come.
So how does all this apply to FX?
Well, FX can be split up into the developed currencies, also known as the G10 currencies. These are the USD, JPY, EUR, GBP, CHF, CAD, AUD, NZD, NOK, SEK (the latter two being the skandies).
However, you also have the emerging market currencies. Any currency falling outside the above more or less belongs to this group. Now trading these can be difficult, due to regulatory issues which create settlement issues, and split the markets into on- and off- shore markets. Other trading issues exist due to Liquidity, availability on brokers, and bid/ask spreads. Similar to the Chinese futures markets, it’s not the easiest (or well-known route) of trading currencies. And so we expect that trading these currencies might add some extra juice.
As discussed on other parts of the blog, a good method of looking at currencies is to bunch them up into an index. For instance we can create a US Dollar index, by creating an equally weighted basket of G9 currencies (the G10 without the US Dollar) against the US Dollar. Similarly we can create an Emerging Market currency basket versus the US Dollar.
For the purpose of this article I’ll focus on: CZK, PLN, HUF, MXN, BRL, TRY, and ZAR. I’ve left a whole host of others, but for these MT4 spit out sufficient history to just give it a wing in terms of analysis.
So now we’ll create the two US Dollar baskets: versus the G9 and versus the above Emerging Market currencies.
And if we plot the two US Dollar baskets we get:
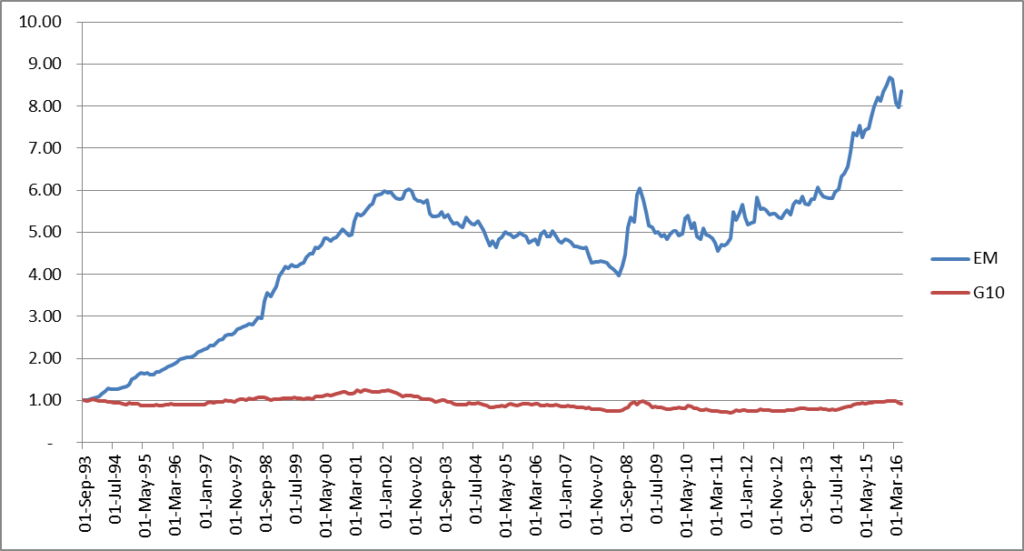
And yes, I’ve adjusted for risk, so that both indices take on the same amount of risk.
The only thing I can say is: astounding!
And applying a very simple 3-month momentum strategy (buy if it’s been up for the last month and sell if it’s been down over the last three months) you get:
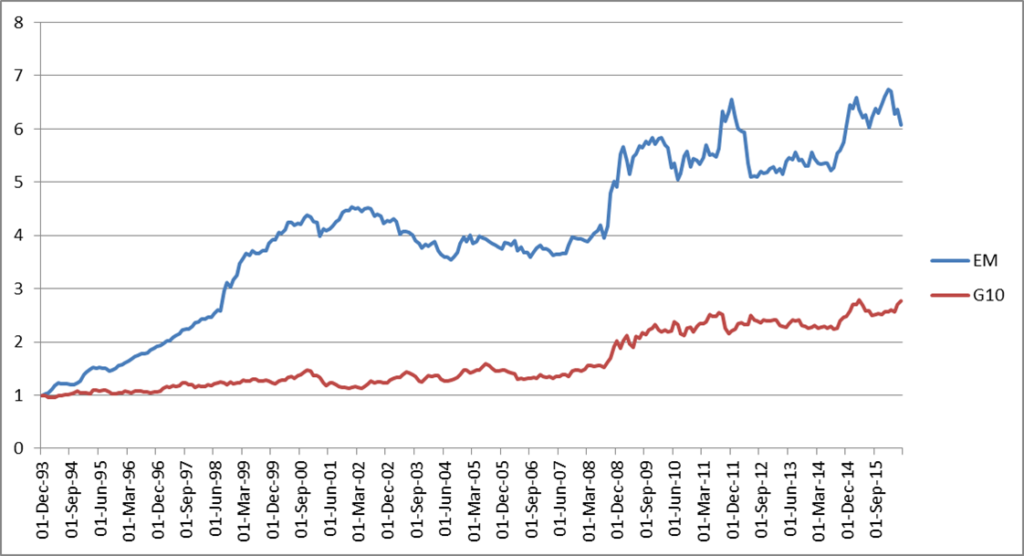
I rest my case. The juice has been so much bigger.
Of course a possible explanation is that during times of crisis, it doesn’t matter which part of the globe an emerging market currency resides, the correlation amongst all them goes to 1, as investor rush for the doors to unload the stuff and flee to safe-haven.
This explains those times the momentum strategy made so much more on the EM side than the G10 side.
Regardless, the lesson here is: find a pond to fish in, especially one that’s not well known, and is smaller in size than the usual fishing grounds.
Happy hunting!
If you have enjoyed this post follow me on Twitter and sign-up to my Newsletter for weekly updates on trading strategies and other market insights!

Great point, one I’ve been thinking about for a while.
Quick question – did you adjust for transaction costs when testing EM?
Hi Arun,
Thank you for getting in touch. The answer is no. The trades happen at the end of every month. Given the monthly swings of the currencies, compared to the bid/ask spread, your cost will be negligible. However, for accurate results, yes, you will have to take that into account.