I’ve been asked lots of questions as to how to determine the next moves in GBPUSD.
There have been many arguments for a bottoming out at the current levels, as well as for a continuation given the strength of the downward move experienced post Brexit.
In this article I’ll try to get a handle on possible outcomes, by looking at some fundamental indicators and see where they point to for sterling over the next couple of months.
The longer term perspective will be more difficult to gauge, since we are still in a state of flux, as long as the political situation hasn’t been clarified. By that I mean the particular details around trade, and how future goods flows will be negotiated between the UK and its future trade partners.
In this article we will start out by analysing domestic output and follow up next week with other economic factors.
But first let’s take a look at Sterling vs the US Dollar over the last 60 years:
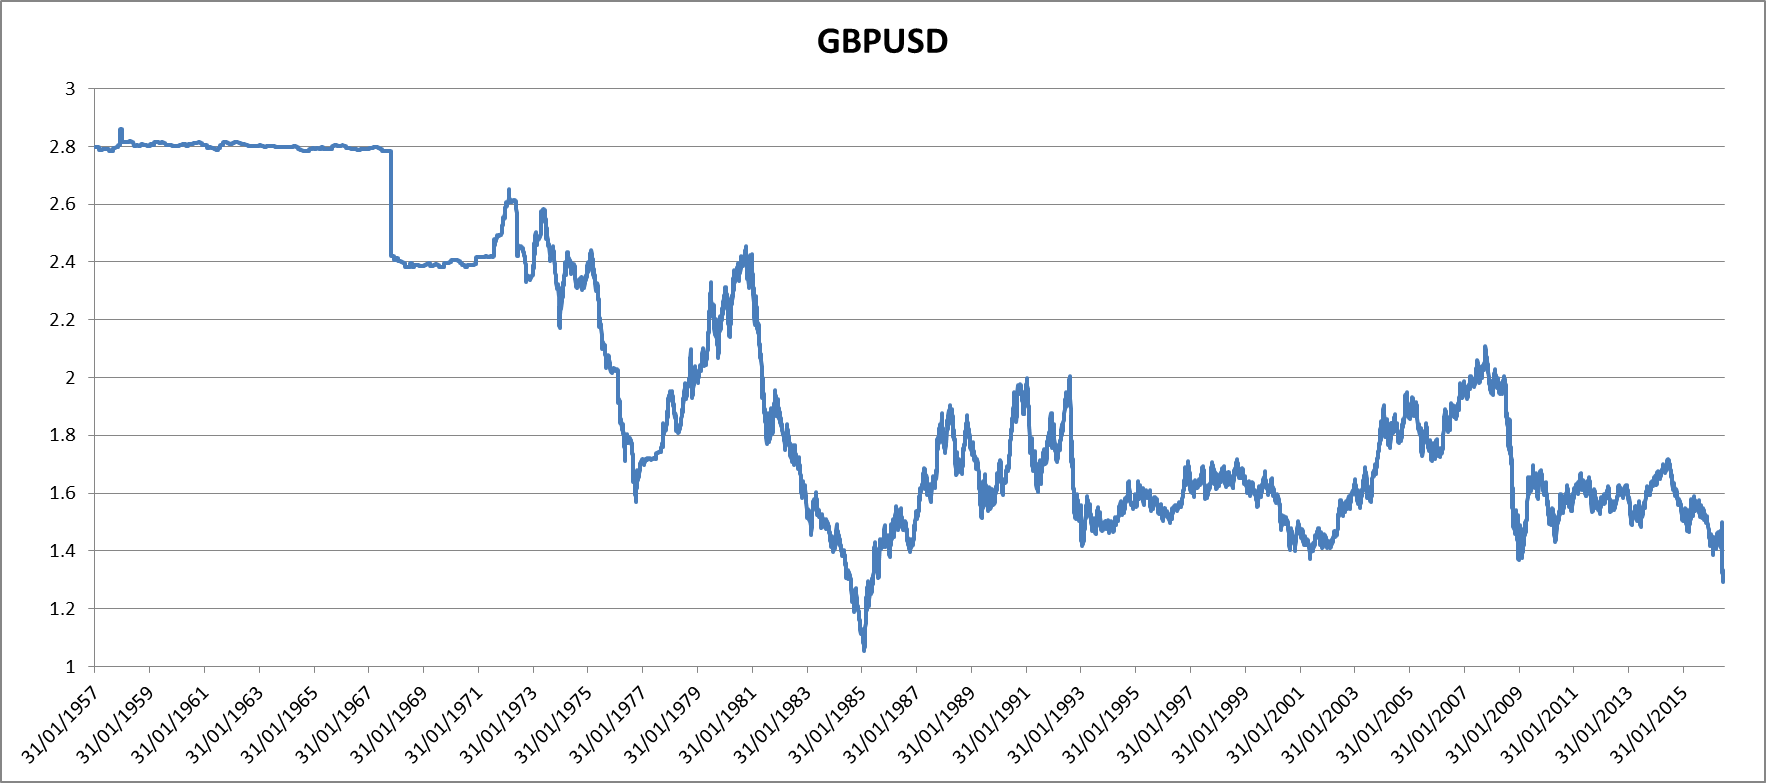
There are some interesting conclusions to be drawn here. At first sight we can definitely identify a long term range, which has included equal or more violent moves than the current Brexit vote. As you can clearly see GBP indeed has broken through and attained multi-decade lows post the Brexit announcement. The headlines were full of this.
However, what happens if we look at GPB versus a basket of currencies; n particular against the G9 currencies (USD, EUR, JPY, CHF, CAD, AUD, NZD, SEK, NOK).
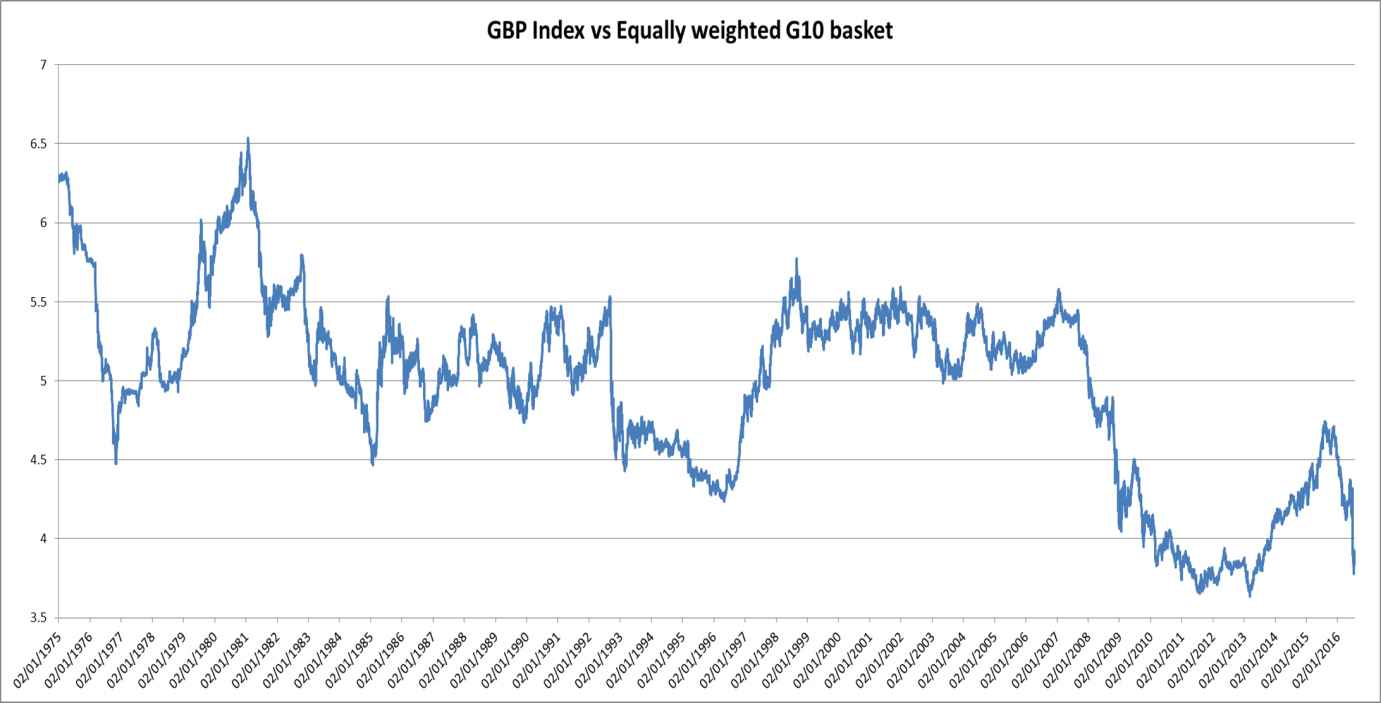
This tells a slightly different story. The “multi-decade” range had been pierced shortly after the GFC, especially after the strong carry-unwind trade driven by the high interest rates in the UK. It’s also interesting to note that all the gains throughout 2013/14 were completely wiped out once the referendum came on the table.
In some sense this tells us that the underlying economic conditions in the UK, are much more endemic, and not necessarily all of a sudden a result of Brexit. They are the result of structural conditions that have been built up for years, in which Brexit acted only as a catalyst. The current account deficit is an oft quoted indicator for that, and we’ll address that next week.
If you are technically inclined it’s very interesting to note that the previous level of 4.5 became strong resistance after 2008, and was also the level at which the pound recovery stalled.
The question of course is now how to get a fundamental handle on these movements.
We’ll approach it from the domestic output angle. On the domestic front, the PMI numbers tend to be popular, as they are a forward looking survey of the businesses within the country. Certainly many equity investors scour them to identify strengths and weaknesses within various sectors.
As such, they are reflective of positive domestic growth shocks if the PMI picks up, and negative shocks if the PMI declines. Domestic growth shocks, which ultimately are reflected in GDP growth (or decline), tend to bring along with them demand for domestic currency and hence an appreciation (or depreciation) of it.
So in this instance we’ll compare the PMI numbers month-on-month and use these monthly changes as an indicator for purchasing or selling the pound. If the PMI increases we buy the pound on the close of the day of the announcement, if it decreases we sell the pound. Note, that the specific PMI figure I chose was the Services PMI, as the services sector for the UK is far more relevant than the Construction or Manufacturing sector.
The strategy is very simple. Of course one hang-up is always the data. I’ve made available on my site a nifty little Python script, which will enable you to download a whole host of economic releases (with time stamps) going back to 2007. The great thing is that this information is not only incredibly valuable, but also utterly free, courtesy of our friends at ForexFactory.
The next question is how to trade the GBP. In this particular example we’ll actually go for GBP against an equally weighted basket of currencies as in the chart above.
The rationale here is that we’ll get a smoother P&L profile, and capture a more diverse flow of money into sterling.
So without further ado, here are the results:
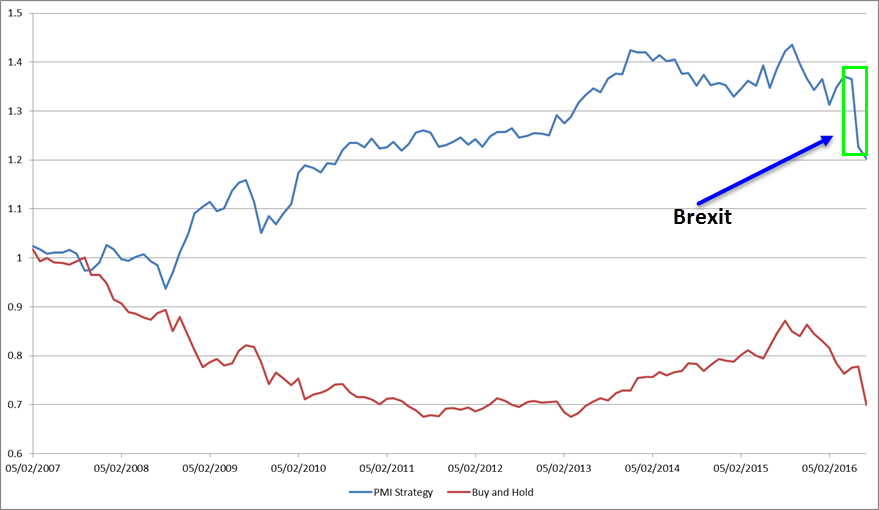
There is one very remarkable event here, and that is Brexit. You see, the PMI number for June was strong, and that no doubt against the backdrop of most people’s complacency that the Bremain camp would win. Buying GBP into such an event is madness, and this is a good example of why manual system intervention in times of extraordinary events is needed. Simply stay out!
Furthermore the July PMI had been surveyed prior to the election event as well. It was only the ad-hoc 22nd July number, which dropped off a cliff, that indicated the concern that followed Brexit, and the pessimism that set in. Playing a bit of Harry-hindsight and removing that outlier leads to:
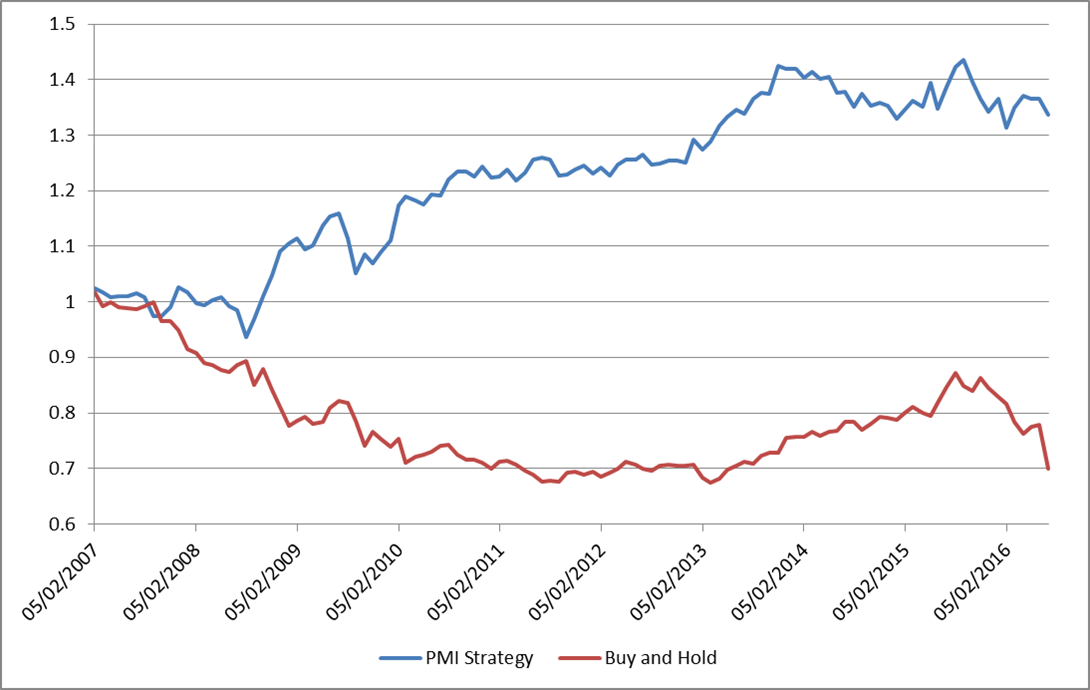
which gives a tidy Sharpe Ratio of 0.5 over the 9 year period. Nothing to be sniffed at, if you include it as part of an overall portfolio
So how do we see GBP over the short term? Given the current continued decline in PMI numbers, and the most recent drop, it’s most likely that the trend will continue to the downside. And most likely get a kicker from the Article 50 catalyst once it’s triggered. That is of course disregarding the conspiracy theory camp, which claims it will never be triggered!
I urge you to give this strategy a shot with the other currencies and their respective PMI figures. As I said above you can get the data by downloading it from ForexFactory using this script I’ve put in the Forex Tools section.
Next week we’ll follow up with some more fundamental economic indicators, and find surprising results in unexpected quarters, so stay tuned!
Happy trading.
If you have enjoyed this post follow me on Twitter and sign-up to my Newsletter for weekly updates on trading strategies and other market insights!

It almost seems like you are trying to build a case for the pound being where it belongs. Is that back testing, or back filling? were it not for Brexit, the pound would be above 1.4 dont you think?
The conspiracy in the British government should be to get a trade agreement in place BEFORE triggering article 50. Then the pound will jump. We will see more of what it happening today, when BOE does NOT! lower rates.
Hi James,
Yes, you could be right there! Post-dictive interpretation is always the easiest. As such, determining the fair-value of GBP can be quite subjective, and we are at the lower bound of the long-term range, which could provide for a turn around.
On the other hand at present it is about sentiment and short term reactions to news. As such, we have an interesting week ahead with the Service PMI numbers coming out tomorrow and the BoE on Thursday. And it’s banging against 1.35 again. So volatility is certainly on the cards.
The other thing to recall is that the move down after the referendum is really a gap. And if you believe in gaps being filled this could be a partial opportunity. At some point the market will get fed up without any clear direction and take a run for it, at least in the short run. As such I tend to aim for lower. But remember, I don’t have a claim on truth.
Coming back to economic fair value, however, you could argue that at some point the currency must adjust to reduce the current account deficit, which in percentage of GDP terms is even larger than the US’s. And given services are core to the UK, and the financial industry, regardless of Brexit, isn’t looking very rosy, that would be another point to GBP decline.
Trade agreement before triggering Article 50? Not sure how this is possible especially when the Europeans appear quite adamant that no negotiations to take place before triggering Article 50. The rise of sterling is suggesting that the markets do not believe that the BOE will deliver (perhaps if they do, it will not be perceived as adequate). The question is whether the market is right? If not, all of the past week’s gains will be erased abruptly. Services PMI tomorrow then BOE thecday after? How does one trade this?
Hi Stuart,
To trade this in your favour, and make it easier for yourself: wait for after the event. Markets are not perfect information processing machines. Information tends to “leak” after the event. And also refrain from trading this stuff intraday, over short time intervals. Take a daily view, and adjust risk appropriately.
A few questions (being after the course they would be corvexits):
1) would trading PMI’s best be done with that country’s biggest trading partner? (all other factors being relatively neutral)
2) is there an easy way to trade one country’s PMI’s against your suggested basket of currencies? The physical challenge of that is daunting, plus in u.s. some trades might wipe out other positions because of the prohibition on spreads.
3) u.s. Housing data is strong, while other data “appears” weak. What indicator is most likely to be affected in a lag behind housing? And presumably in turn, move the dollar
Hi James,
1) That is a good question, and it makes a lot of sense. In essence you could trade one PMI off the other by looking at relative strength / weakness. So probably you would look at both countries’ PMIs in that case, and if one outperformed the other you would go long that currency versus short the other
2) You can trade currency indices via specific instruments. For instance for the US Dollar you have the DXY. For GBP I just found this ETF: “ETFS Bullish GBP vs G10 Currency Basket Securities .” It seems that the ETF space has other such instruments for the various currencies.
3) Building permits have definitely had a strong into 2015, but have plateaued since. Using these as a housing indicator you could then look at mortgages, with lower permits, less mortgages would be given out, and hence the banking sector would suffer. This would be one chain of reasoning. I’ve found that Lumber futures are also a good indicator for the housing market. It certainly forebode the blow-up of 2007/08. You can chart these (and almost anything else!) on tradingview.com