In previous articles I’ve written about the idea of Kelly betting or using leverage to really boost the growth of your returns. I’ve also shown how different fundamental components work together to create an FX Benchmark index.
This article is slightly different. I want to keep it KISS: “Keep It Simple Stupid.” I will show you how to combine several instruments (three in actuality), which will create a Hedge Fund Benchmark. And then we apply leverage to this index, and see what happens (spoiler alert: lots of good stuff happens).
The article will be slightly heretical in the sense that we won’t touch FX as such. Why? Well, trading is trading, doesn’t matter if it’s bonds or beans, but more importantly it outlines the key-principles underlying the ideas of:
- Extracting Long-Term growth from fundamentals
- Making tonnes of money with the right money-management
As such I wanted to keep the underlying tradeables as simple as possible. If you inject the FX Benchmark approach into this formula, the returns will be even bigger.
So here it goes. In the true sense of today’s title “Trade Like a Hedge Fund,” we’ll decompose their strategies, find the things we can trade and stick it together.
Excited? I am. I loved the results.
To determine the strategies we need to understand the asset classes that are out there that we can trade. This is the easy bit:
- Equities
- Bonds
- Commodities
I’ve left currencies out, for the very reason that at present, unlike the other three asset classes above, there aren’t any benchmarks that are being marketed to retail investors. Also, because I firmly believe in creating your own FX benchmark. So I’ll cover the FX bit in a later article in greater detail, and how it fits in with the three asset classes above.
So what do we know about these three asset classes?
- Equities: long-term growth, regardless of what people say. We could also time them (which we will), or select on the two factors that we know tend to out-perform: value and size.
- Bonds: go up, they pay coupons, period.
- Commodities: they’re driven by cyclical trends.
So what can we do?
Equities:
We go long the S&P500, Russell 2000, or a value Index. Turns out it doesn’t matter too much, so we’ll go for going long the S&P500. We’ll do this via the SPY ETF
Bonds:
Since we are US centric in terms of the asset classes considered in this article, we’ll look at the iShares Core US Aggregate Bond Index. The corresponding ETF is AGG
Commodities:
We’ll use the GSCI index, which is also available via ETFs: the ticker is GSG.
However, as we said, it’s not the commodities themselves that provide the kicker, but the trends the naturally tend to exhibit. How can we achieve this in a simple way?
Easy: we look at the three month momentum of the GSG at the start of every month and decide if we hold GSG long or short for the next month.
In detail: let’s say it’s the first of the month and we have to decide if we go long commodities or short. We compare the price of GSG today compared to the three months ago. If it’s higher we buy the GSG and hold for the next month, if it’s lower we short and hold for the next month. Rinse and repeat at the start of every month.
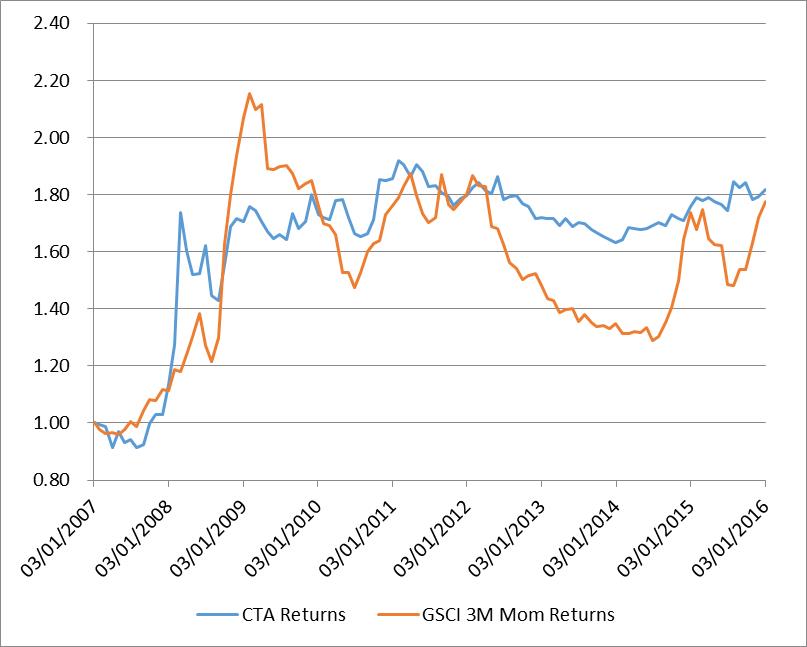
This might sound naïve, but let me show you a chart of this simple GSCI/GSG method compared to what a sophisticated trend-follower would do. (Remember we are only looking at the commodity sector here):

More or less identical. Ok, ok the drawdown on the GSCI strategy was lower, but the rebound was stronger. What’s going on here? Some money management on the part of the CTA (trend-follower): as drawdowns increase he will reduce his exposure. Nothing we need to concern ourselves with as you will soon see.
Strategy:
So let’s list out the components so far. We have identified our assets / instruments / strategies:
- Equities: long SPY
- Bonds: long AGG
- Commodities: 3 Month Momentum on GSG, rebalanced monthly
So how do we put them together? We’ll borrow the notion of Risk Parity. In essence this tells us that we should buy those amounts of each asset, such that each asset class contributes equally to the P&L.
In this particular instance it means: buy one unit of SPY, 3.5 units of AGG, and half a unit long/short of GSG depending on the momentum consideration. Note that only the GSG position needs to be managed on a monthly basis. This works out to: 20% in Equities, 70% in bonds, 10% in trend-following commodities.
So what is the outcome?
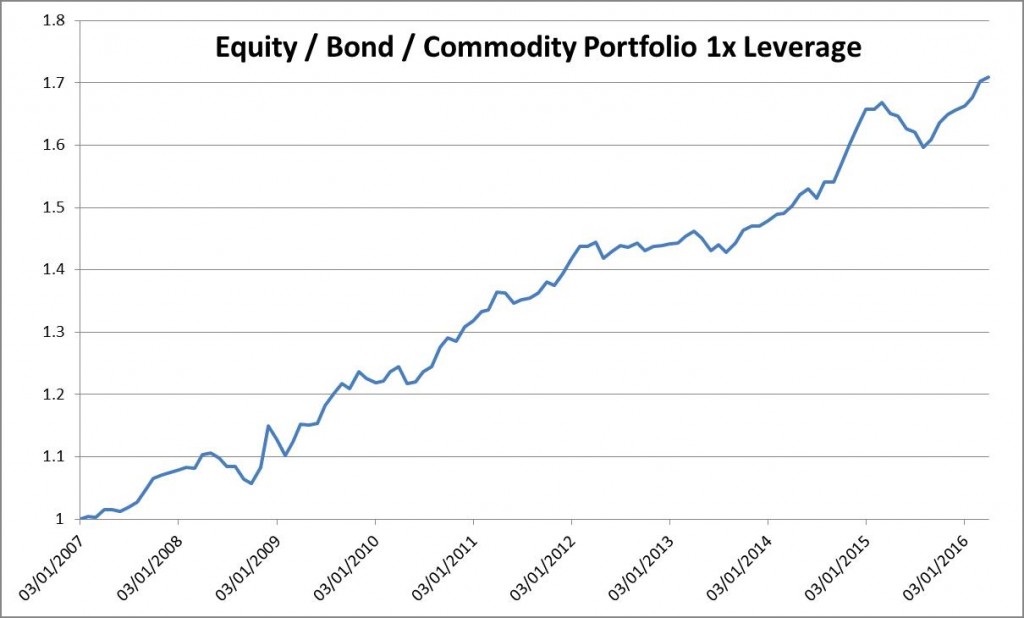
Let’s consider only leverage of 1 (for which you at present only need $1,200). The result since 2007 is:

Looks nice!
What are the stats on this?
Annual return: 5.9%, with a maximum drawdown of -4.5%. That’s even better. And the Sharpe Ratio? That’s at a whopping 1.4. Putting this into perspective you probably landed in the top 5% of hedge funds on this planet.
But of course, who wants a measly 6%? Recall that with a Sharpe of near 1.5 we can double our money on average every 7 months, give or take, if we use half-Kelly. So what is the Kelly leverage in our case? Well it’s the yearly return (=5.9%) divided by the square of the yearly average P&L swing (=4.2%, slightly less than the max drawdown, which is good as well). So 5.9%/4.2%^2 = 33. So half-Kelly leverage means a leverage of 15x. Let’s be conservative and look at 10x leverage.
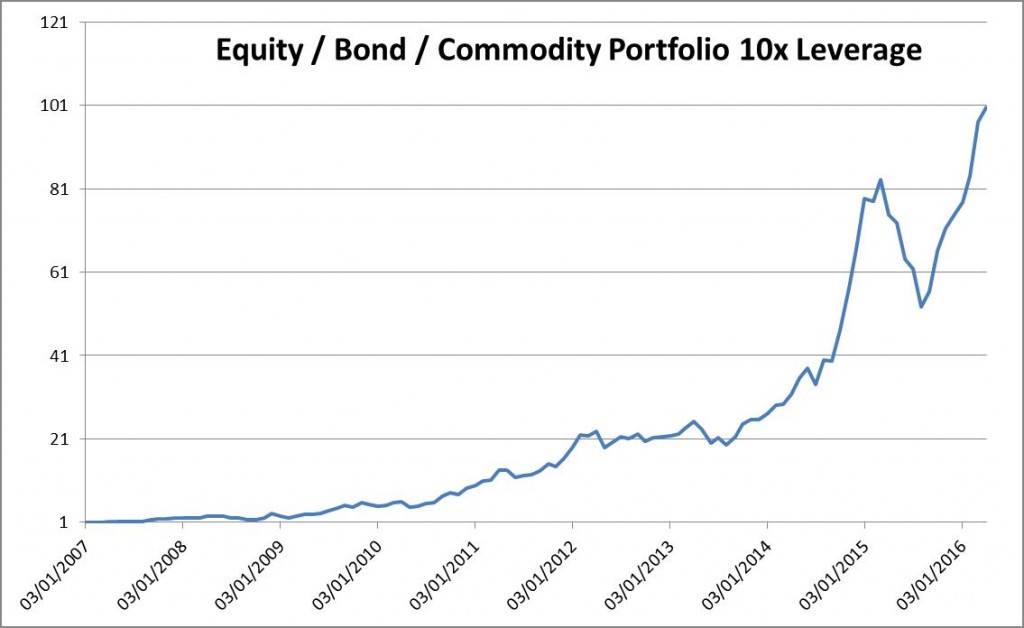
What kind of returns are we looking at now?

The stats on this?
60% annual return with -40% maximum drawdown. If we use drawdown to measure risk, then compared to the 50% on the S&P500 this portfolio completely knocks it out of the park.
I’m including the spreadsheet so that you can follow the calculations here.
What’s the takeaway message here?
Simple: EDGE and RISK Control will knock it out of the ball-park for you time and time again. And neither is rocket science, or some hidden mystery. It’s right there in front of you.
If you have enjoyed this post follow me on Twitter and sign-up to my Newsletter for weekly updates on trading strategies and other market insights!

You’ve got me exicited! One thought springs to mind about drawdown. If you know the distrbution of the drawdowns are there likely to be gaps between the normal swing drawdowns and the once in a decade (or perhaps 18 years) large drawdown? I am thinking you could then put a stop on the S&P, at say, 15% and smooth the equity further.
Hi Yvonne,
The other way to smooth out the drawdowns is to trade the momentum on the back of the S&P 500 as I wrote in the current article: S&P 500 Market Timing.
The issue with the approach of having a static stop is that at times you are throwing the baby out with the bathwater. You also have the question as to when to re-enter the S&P. Therefore it feels imposing a momentum filter on top of it might be better.
‘So how do we put them together? We’ll borrow the notion of Risk Parity. ‘
How is risk parity calculated? Using the ATR?