Short update on AUDUSD and the AIG Construction index on the 7th January, 2016, 22:30 GMT.
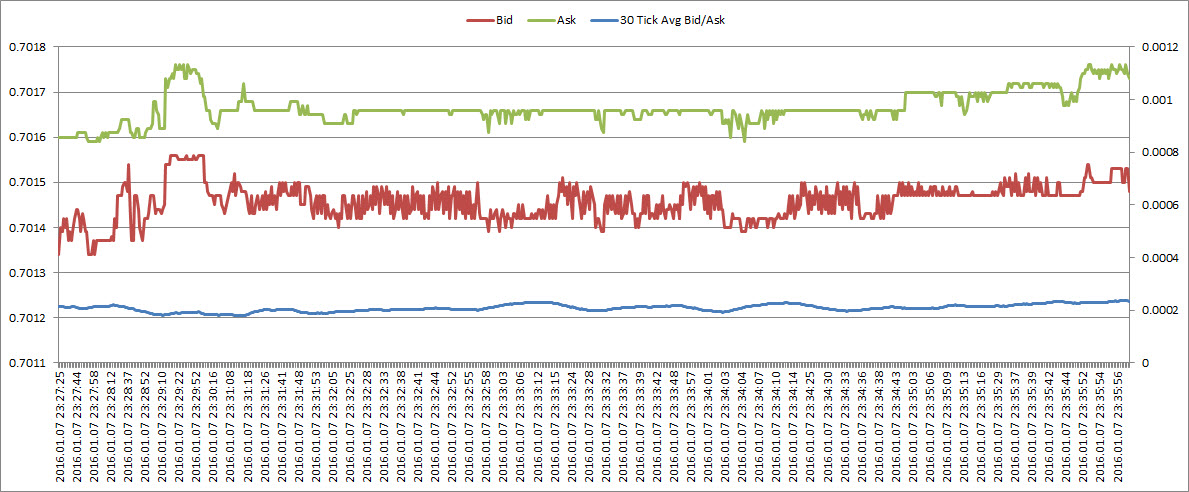
There is a reason ForexFactory labelled this as yellow (which seems to be the lowest importance rating they give to news releases). The market was completely comatose, both from a tick count per minute basis, as well as from the perspective of the bid/ask: was wide / stayed wide / couldn’t be bothered. And of course AUDUSD stayed where it was as well. However, both of these are poor indications to draw conclusions from: at 22:30 GMT nobody’s around. NY went to bed, and Sydney has barely woken up. Only people around to trade are the poor suckers who can’t get away from the slot machine.
Will therefore have to look for next irrelevant item (yellow/orange grade) to study.
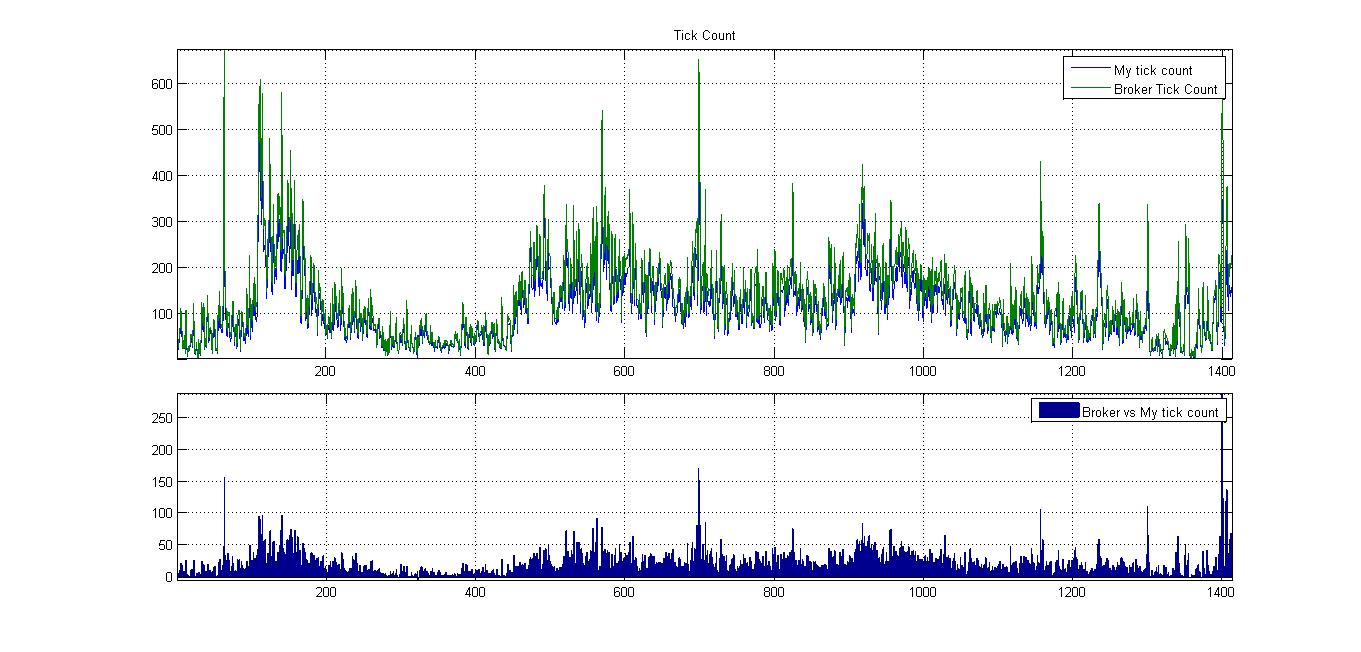
However, given that I already have the data up and running a simple sanity checked crossed my mind. On the one hand I’m sucking data out the broker feed. So this is the information I trade off. On the other hand the broker has his own view of the world. How much do the two correspond? Straightforward test: do the tick counts the broker registers correspond to what I see.
Quick download from the MT4 history center and a comparison to my csv file gives following picture of tick counts:
During the quiet hours of the day it’s not too much of a difference. When the market gets going, however, it looks like they register more ticks than they feed through to my computer. This re-affirms my view: pending orders are where it’s at, otherwise the reaction time is too slow when it comes to focusing on very short term horizon trades.
As an aside, I’m starting to trust this tick count stuff more. How it relates to real volume remains to be seen…
Up next the NFP!


Leave a Reply